INTRODUCTION
Importance of smoke-free policies
Tobacco is the leading cause of preventable illness and death in the USA1. It causes many different cancers as well as chronic lung diseases, such as emphysema and chronic bronchitis, and heart disease in direct users. Furthermore, exposure to secondhand smoke causes premature death and disease, in both adults and children non-smokers2. Ample evidence shows that implementation of indoor smoke-free policies can significantly reduce tobacco use, tobacco-related disease in the U.S., and secondhand-smoke exposure among non-smokers. Multiple Surgeon Generals’ reports speak to that effect and underscore the additional benefits of smoke-free laws in decreasing and lowering smoking rates among youth and young adults3-5.
A surge of publications in the recent decade affirms the effectiveness of smoke-free policies on health behavior and outcomes among different populations: IARC handbook, for example, reviews the evidence on the economic effects and health benefits of smoke-free legislation6. The Community Preventive Services Task Force report demonstrates the effects of smoke-free policies on reducing exposure to secondhand smoke, prevalence of tobacco use among young people, and tobacco-related morbidity and mortality7. The results from national surveys, on youth smoking, strongly suggest that smoke-free workplaces and homes are associated with significantly lower rates of adolescent smoking8. Other evidence suggests that young people living in towns with laws that completely prohibited smoking in restaurants had lower rates of progression to smoking than young people living in towns with weaker laws or no smoke-free laws9. Wintemberg et al.10 found evidence of lower current smoking prevalence and greater intentions to quit among sexual and gender minorities who live in communities with smoke-free policies. Recent systematic review of tobacco-policy research finds that current evidence provides more robust support for the earlier conclusions that the introduction of smoke-free policies leads to improved health outcomes, suggesting that the policy not only affects the decrease in exposure to smoke but also produces an antismoking social norm11. These and similar findings have highlighted the critical importance of implementing smoke-free laws to protect non-smokers from exposure to secondhand smoke, lower tobacco use, and tobacco-related disease in the USA12.
Smoke-free policies in the USA
Today, most States in the USA have enacted some form of smoke-free policy. However, there are differences between and within States in the types of laws and extent of tobacco policy coverage. The differences include: 1) types and number of indoor areas that the law covers, ranging from those covering all indoor areas in workplaces, restaurants and bars, to partial coverage in only one or two of these areas; 2) geographic extent of the tobacco policy coverage, ranging from all counties being covered in a particular State to only one city being covered in a given county; 3) length of time since the smoke-free policy came into effect, ranging from 25 years to less than one year of coverage; and 4) number of people who are protected by the smoke-free law within a particular geographic area (city, county, State, Census region)13-14. Currently, there is no concrete strategy to systematize this information for the benefit of: 1) understanding the historical patterns of smoke-free policy adoption and coverage in the U.S., and 2) population based research to quantify the health impacts of smoke-free policies over time.
The aim of this research was to reconstruct the historical patterns of smoke-free policy coverage in the U.S. and to accomplish the following two complementary objectives. First, U.S. geographic locations were characterized based on the percentage of population covered by indoor smoke-free laws, over the period 1990-2014. Second, a web-based interactive tool Tobacco-Policy-Viewer was developed for visualization and download of the U.S. historical smoke-free policy data for research.
From a public health standpoint, the results of this study may inform where to focus efforts to develop comprehensive smoke-free policies, both locally and regionally. The same information will be useful for evidence-based research to broaden our understanding of the relationship between tobacco prevention and control activities, smoking behavior, exposure to secondhand smoke, and tobacco-related health outcomes.
METHODS
The data for this project were extracted in 2016 from ‘Chronological Table of U.S. Population Protected by 100% Smoke-free State or Local Laws’, which is publicly available for download from the American Nonsmokers’ Rights Foundation (ANRF) website14. The table includes: 1) the date when the smoke-free policy came into effect; 2) the name of the city, county, or State that adopted the policy; and 3) the total population1 covered by the policy. The original data were transformed and the data attributes organized in a way that is suitable for spatial and temporal data analysis.
Reconstruction of historical patterns of smoke-free policy
The methodological steps involved in reconstruction of historical patterns of smoke-free policy in the U.S. included the following steps. (A) Geo-referencing: assigning a standard geographic identifier to cities, counties, and States that adopted smoke-free laws and join them with the corresponding geographic boundary and attribute files. (B) Data linkage: linking information on the year in which each city, county, or State implemented Local or State smoke-free policy in workplaces, restaurants or bars, with information on the total population of each city, county, or State using Census 2010 population counts2. (C) Analysis: computing the percentage of population covered and years of coverage by smoke-free laws in workplaces (using the ANRF definition of workplace - non-hospitality workplaces including but not limited to offices, factories and retail stores), restaurants and bars, by county, State and Census region, by year, for the period 1990-2014. (D) Data visualization: mapping and charting data to illustrate spatial and temporal patterns of tobacco policy coverage in the U.S. Mapping was performed using Arc GIS 10.4 software, Esri Inc.
The most challenging aspect of the development of this data resource was integrating the data at multiple spatial scales that were often overlapping. Smoke-free laws have been passed by cities, counties, and States across the USA. County laws usually, but not always, apply only to unincorporated portions of the county. There are many U.S. cities that include parts of more than one county. Methods were developed to deal with these complexities and ensure that cross totals of the populations covered by the laws at the different spatial scales were consistent.
Development of the Tobacco-Policy-Viewer
The Tobacco-Policy-Viewer was designed to augment other existing tobacco policy tracking systems, namely: 1) The U.S. Tobacco Control Laws Database© from the ANRF19, an extensive collection of State and Local tobacco control ordinances, by-laws, and Board of Health regulations and, 2) The State Tobacco Activities Tracking and Evaluation (STATE) System from the CDC20, a comprehensive resource of current and historical State-level data on tobacco use, prevention, and control.
The design and development of the Tobacco-Policy-Viewer were guided by the earlier successful effort to create a community health information portal, which is known as the PopSciGrid pilot project18. The Tobacco-Policy-Viewer was implemented in HTML, CSS, and JavaScript leveraging the Esri JavaScript API version 3.1721 and Map Services published to Esri ArcGIS Server22. The tool provides access to the full set of spatiotemporal data on the evolution of smoke-free laws in the U.S., as described in the previous section.
RESULTS
Historical patterns of smoke-free policy coverage
Efforts to limit exposure to secondhand smoke began in the 1970s with legislation requiring non-smoking areas in public places and on commercial airline flights. In the 1980s, legislative requirements for non-smoking areas expanded to cover private workplaces as well. The U.S. Department of Health and Human Services established a smoke-free policy for all its buildings. Smoking was banned entirely on domestic airline flights of two hours or less. Prior to legislated smoke-free workplace policies, many workplaces voluntarily adopted policies limiting where smoking is allowed15,16. This section describes the population coverage by the smoke-free policy at the Local, county, State, regional and national levels of geography.
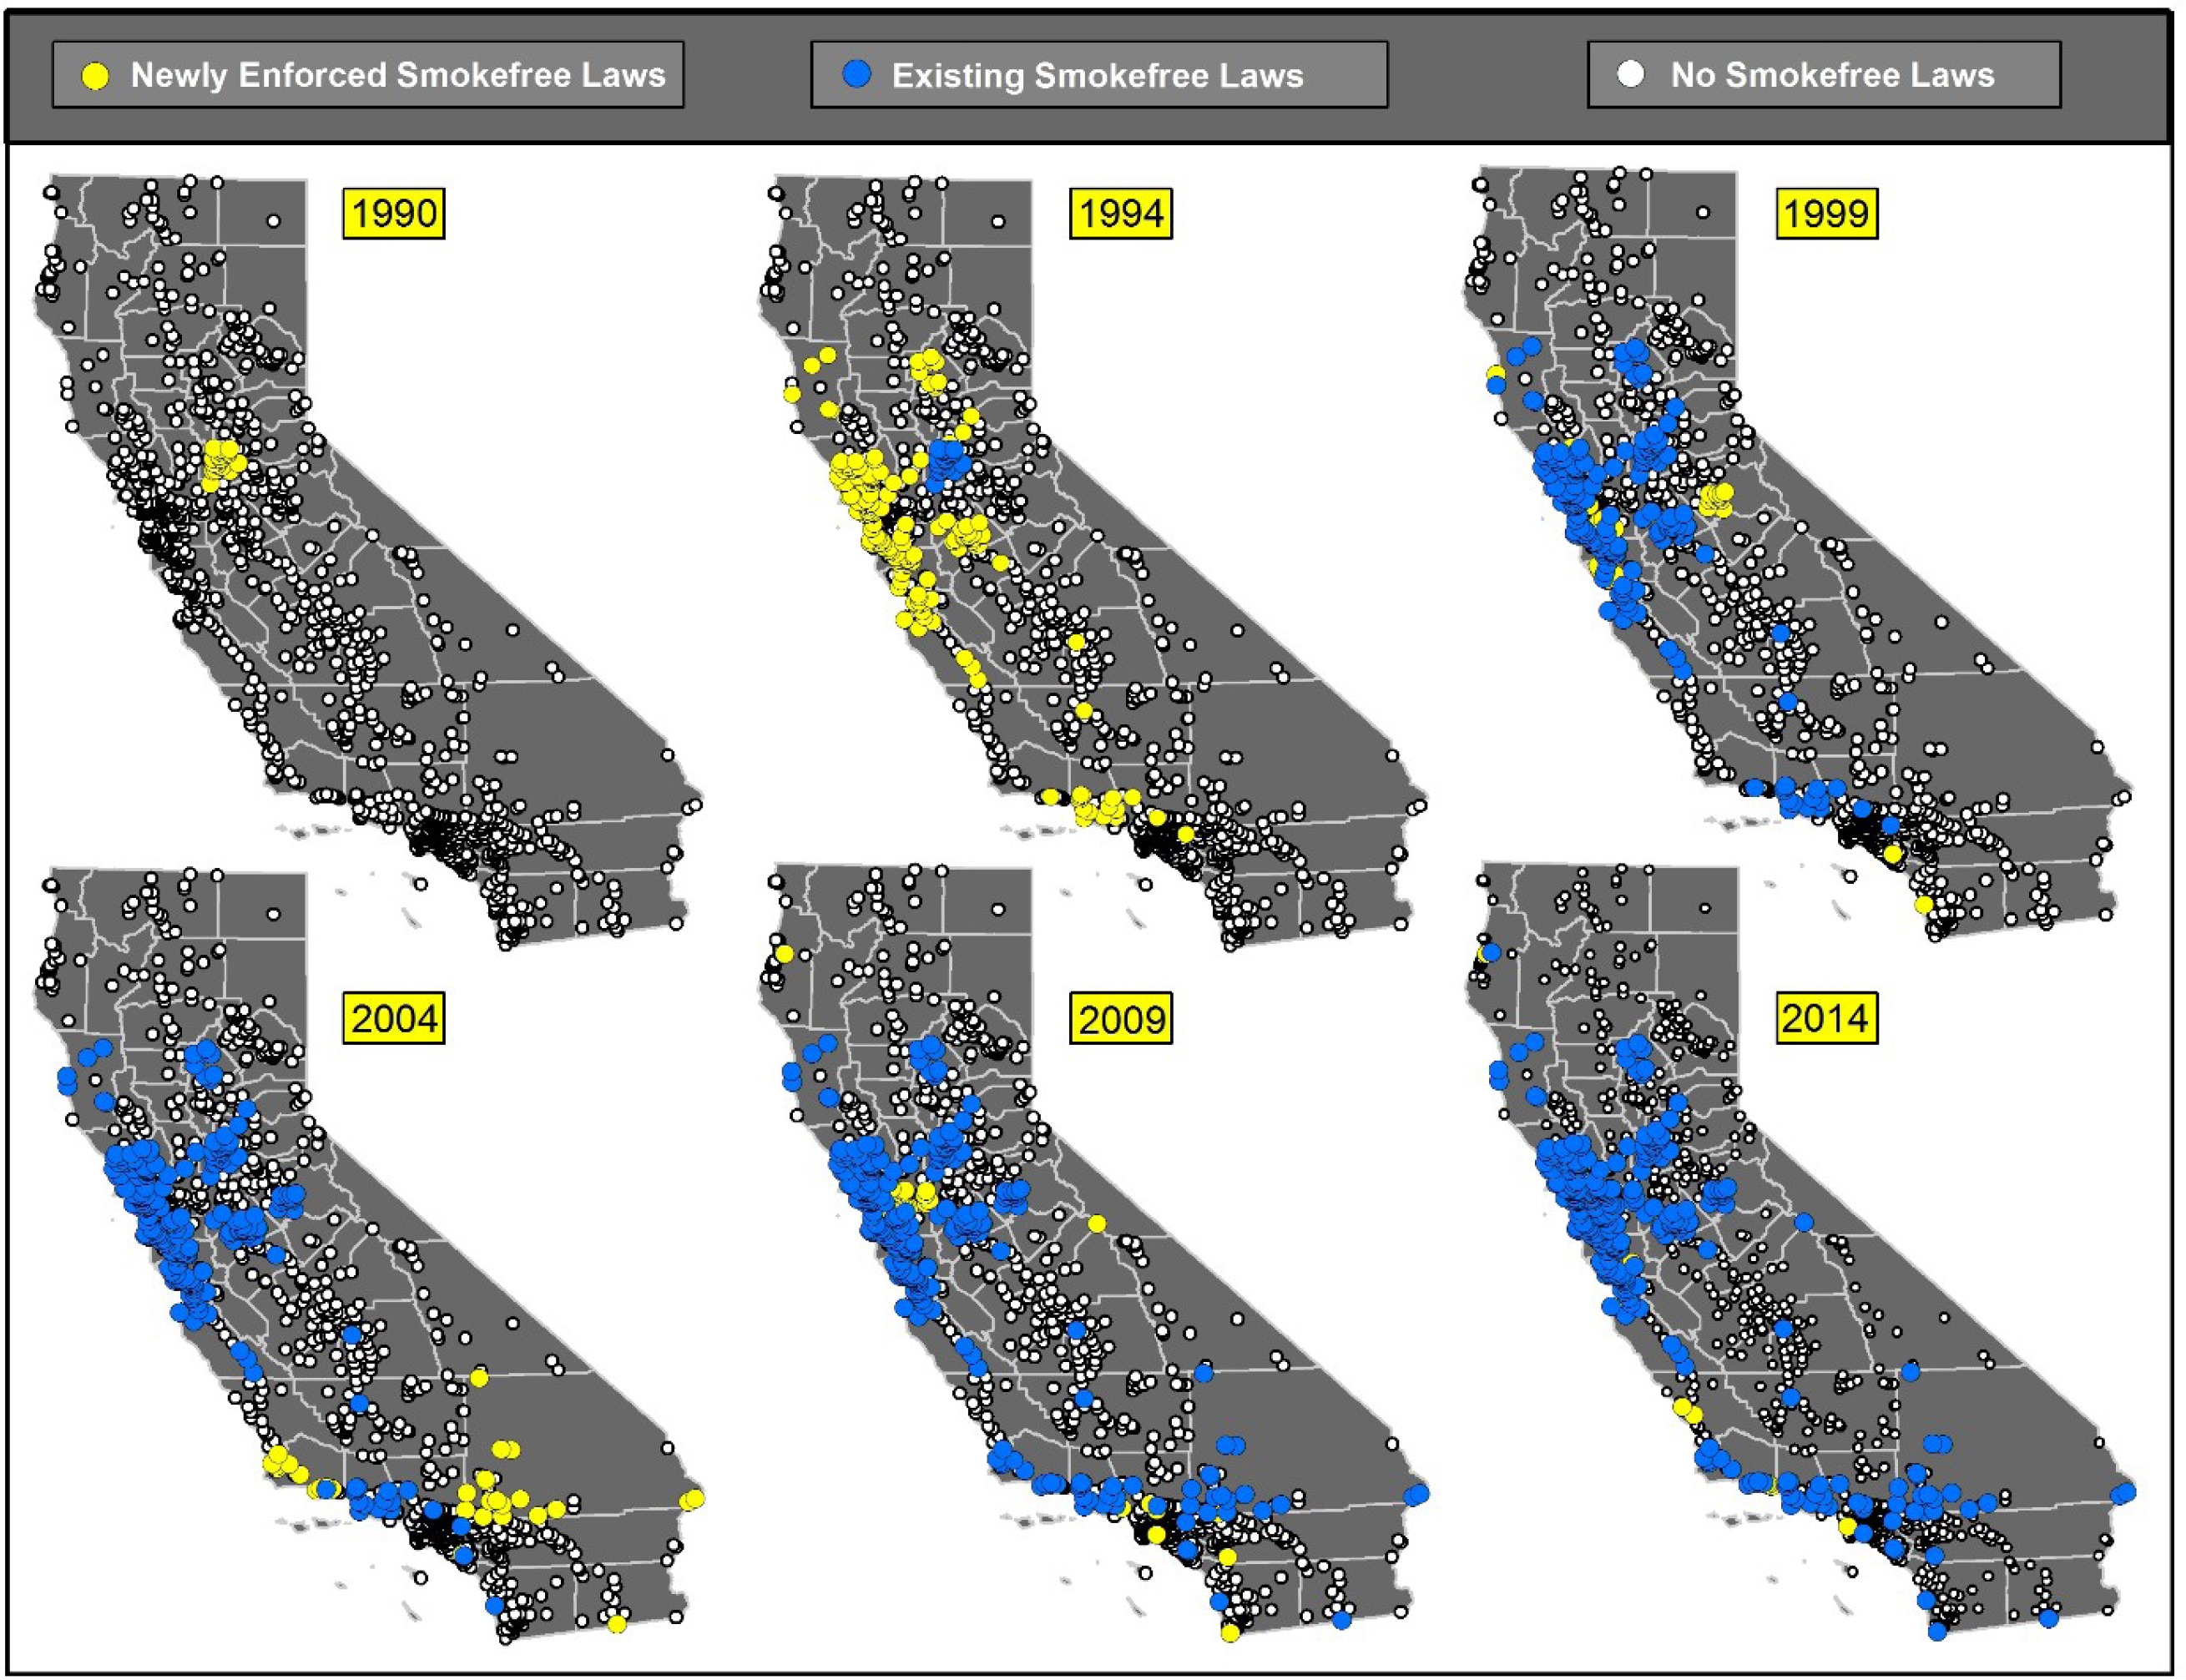
The history of 100% smoke-free policy legislation begins in California (CA)17. As reported by ANRF, the first 100% smoke-free law prohibited smoking in restaurants and freestanding bars, and took effect on 2 August 1990 in the city of San Luis Obispo, CA13. In the same year, 30 places in Sacramento County (Figure 1) that comprised 3% of the CA population (Table 1), adopted the law that prohibits smoking in workplaces. By the end of 1994, over 200 jurisdictions in California (18 % of the CA population) had passed laws mandating smoke-free workplaces. Over the next two decades 350 cities in California implemented smoke-free regulations in workplaces, covering 26% of the CA population.
Table 1
Percentage of population covered by smoke-free laws in WORKPLACES, by U.S. state, 1990-2014
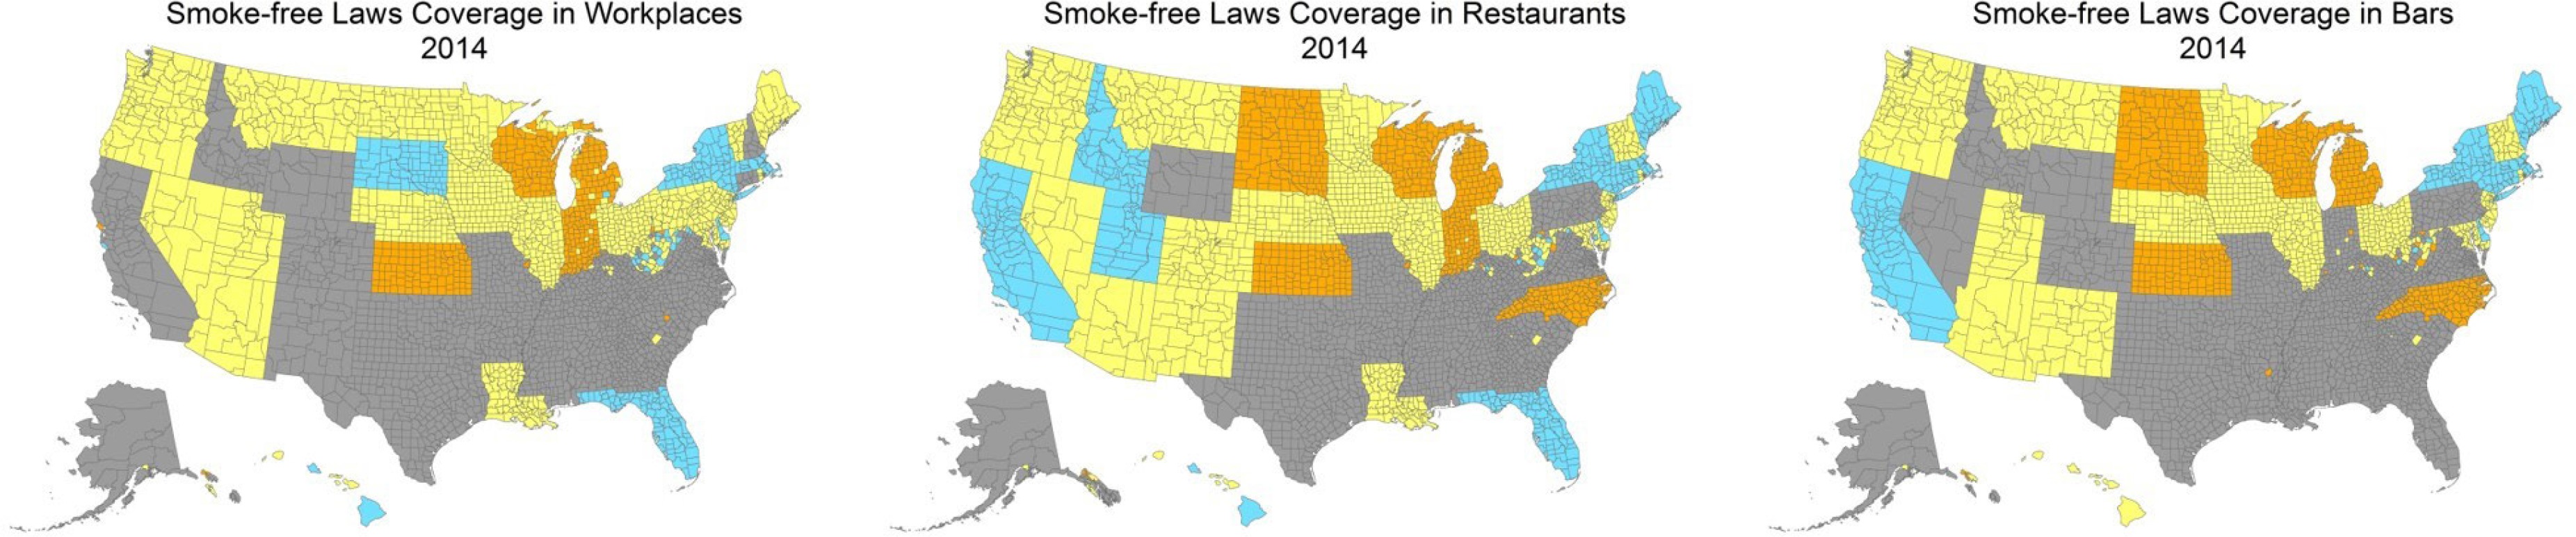
At the county level, the first comprehensive smoke-free law (covering all three indoor areas: workplaces, restaurants, and bars) was implemented by Shasta and Davis Counties in California in 1993. Figure 2 shows counties covered by the smoking laws in workplaces, restaurants, and bars, respectively, and the length of time for which they have been covered. Some counties have never adopted smoke-free laws, while others have had smoke-free laws for over one decade. Counties in Florida, for example, have had smoke-free laws for workplaces and restaurants for more than ten years, but not for bars. Similarly, in California, many counties have had smoke-free laws in workplaces long before the smoke-free laws in restaurants and bars.
Figure 2
County level distribution of 100% smoke-free laws in workplaces, restaurants, and bars, 2014
While historically, California was the first to adopt local tobacco-free laws, per ANRF, it was not the first to implement statewide tobacco-free policies. The first statewide tobacco control provision was implemented in Utah in 1995 (Table 2), with the law that prohibits smoking in restaurants. California implemented a statewide law prohibiting smoking in restaurants and attached bars in 1998. These two States were the pioneers in protecting their populations from indoor smoking in the period 1995-1999. The first comprehensive smoke-free law was implemented in Delaware in 2002, followed by New York in 2003. Widespread adoption of smoke-free tobacco laws occurred in the period 2005-2009, and by the year 2014, 30 U.S. States had laws requiring smoke free workplaces, 36 had laws for restaurants, and 31 had laws for bars, respectively (Tables 1-3).
Table 2
Percentage of population covered by smoke-free laws in RESTAURANTS, by U.S. state, 1990-2014
Table 3
Percentage of population covered by smoke-free laws in RESTAURANTS, by U.S. state, 1990-2014
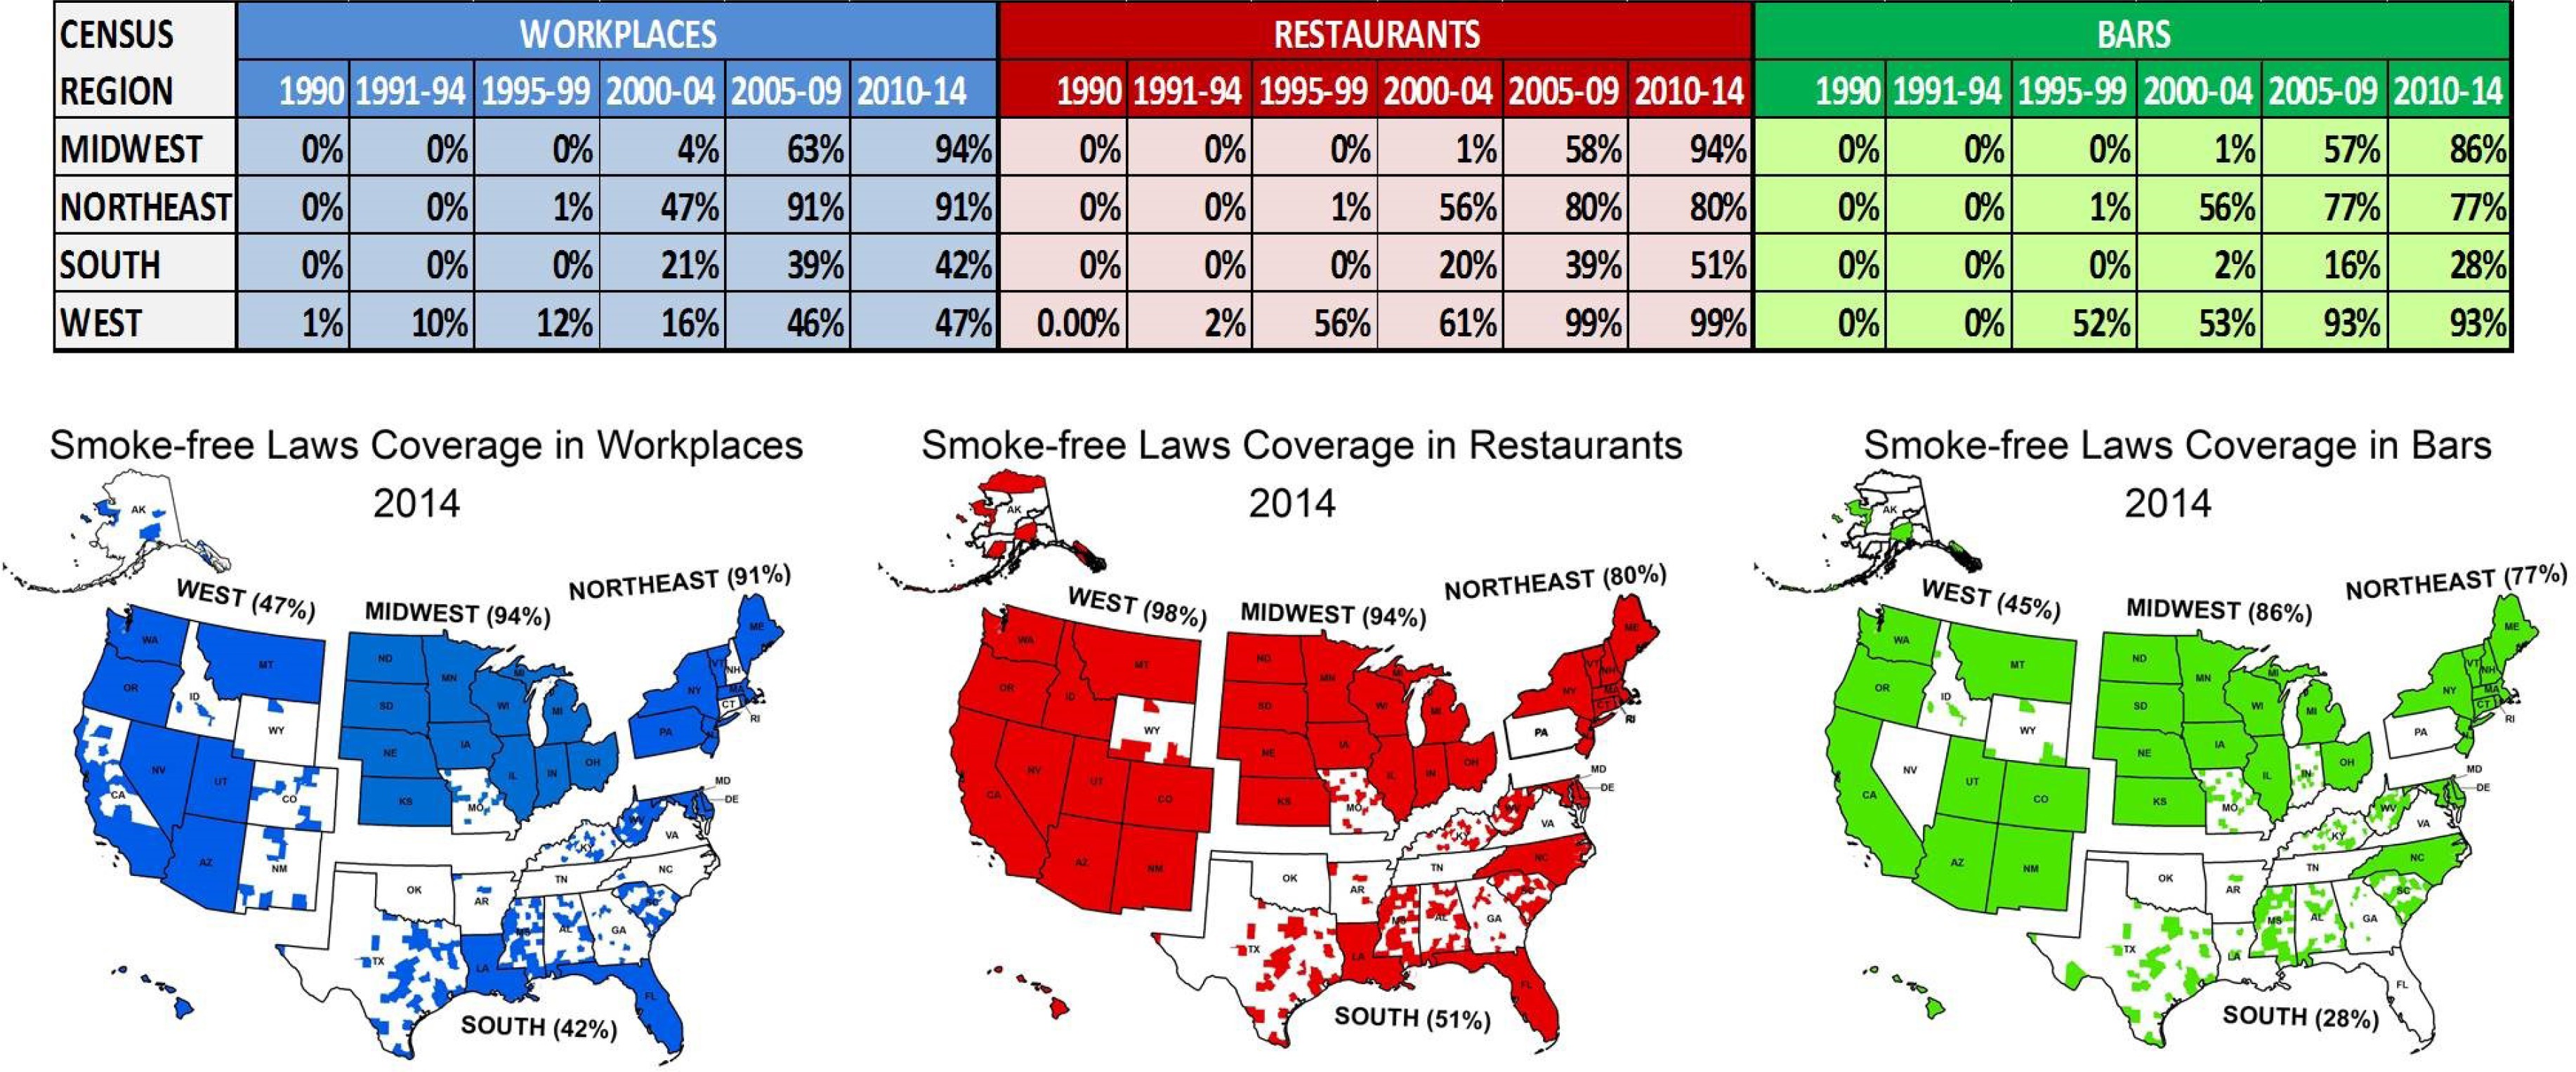
At the regional level (Figure 3), the West Census region has the earliest history of smoke-free laws; by the year 1999, 12% of its population was smoke-free in workplaces, 56% in restaurants, and 52% in bars. The adoption of smoke-free laws in this region continued, so that by 2014, 47% of the population was covered by tobacco laws in workplaces, 99% in restaurants, and 93% in bars. In the other three regions, the smoke-free laws did not begin to cover a substantial portion of the population until 2000. In the Midwest and Northeast regions, by 2014, the majority of people were smoke-free in workplaces, restaurants and bars (ranging from 77% to 94%). In Southern States, however, smoke-free policies were adopted more slowly, and the resulting population coverage was lower; by 2014, 42% of the Southern regions’ populations were smoke-free in workplaces, 51% in restaurants, and 28% in bars.
Figure 3
Population covered by smoke-free laws in workplaces, restaurants, and bars, by U.S. Census Region, 1990-2014
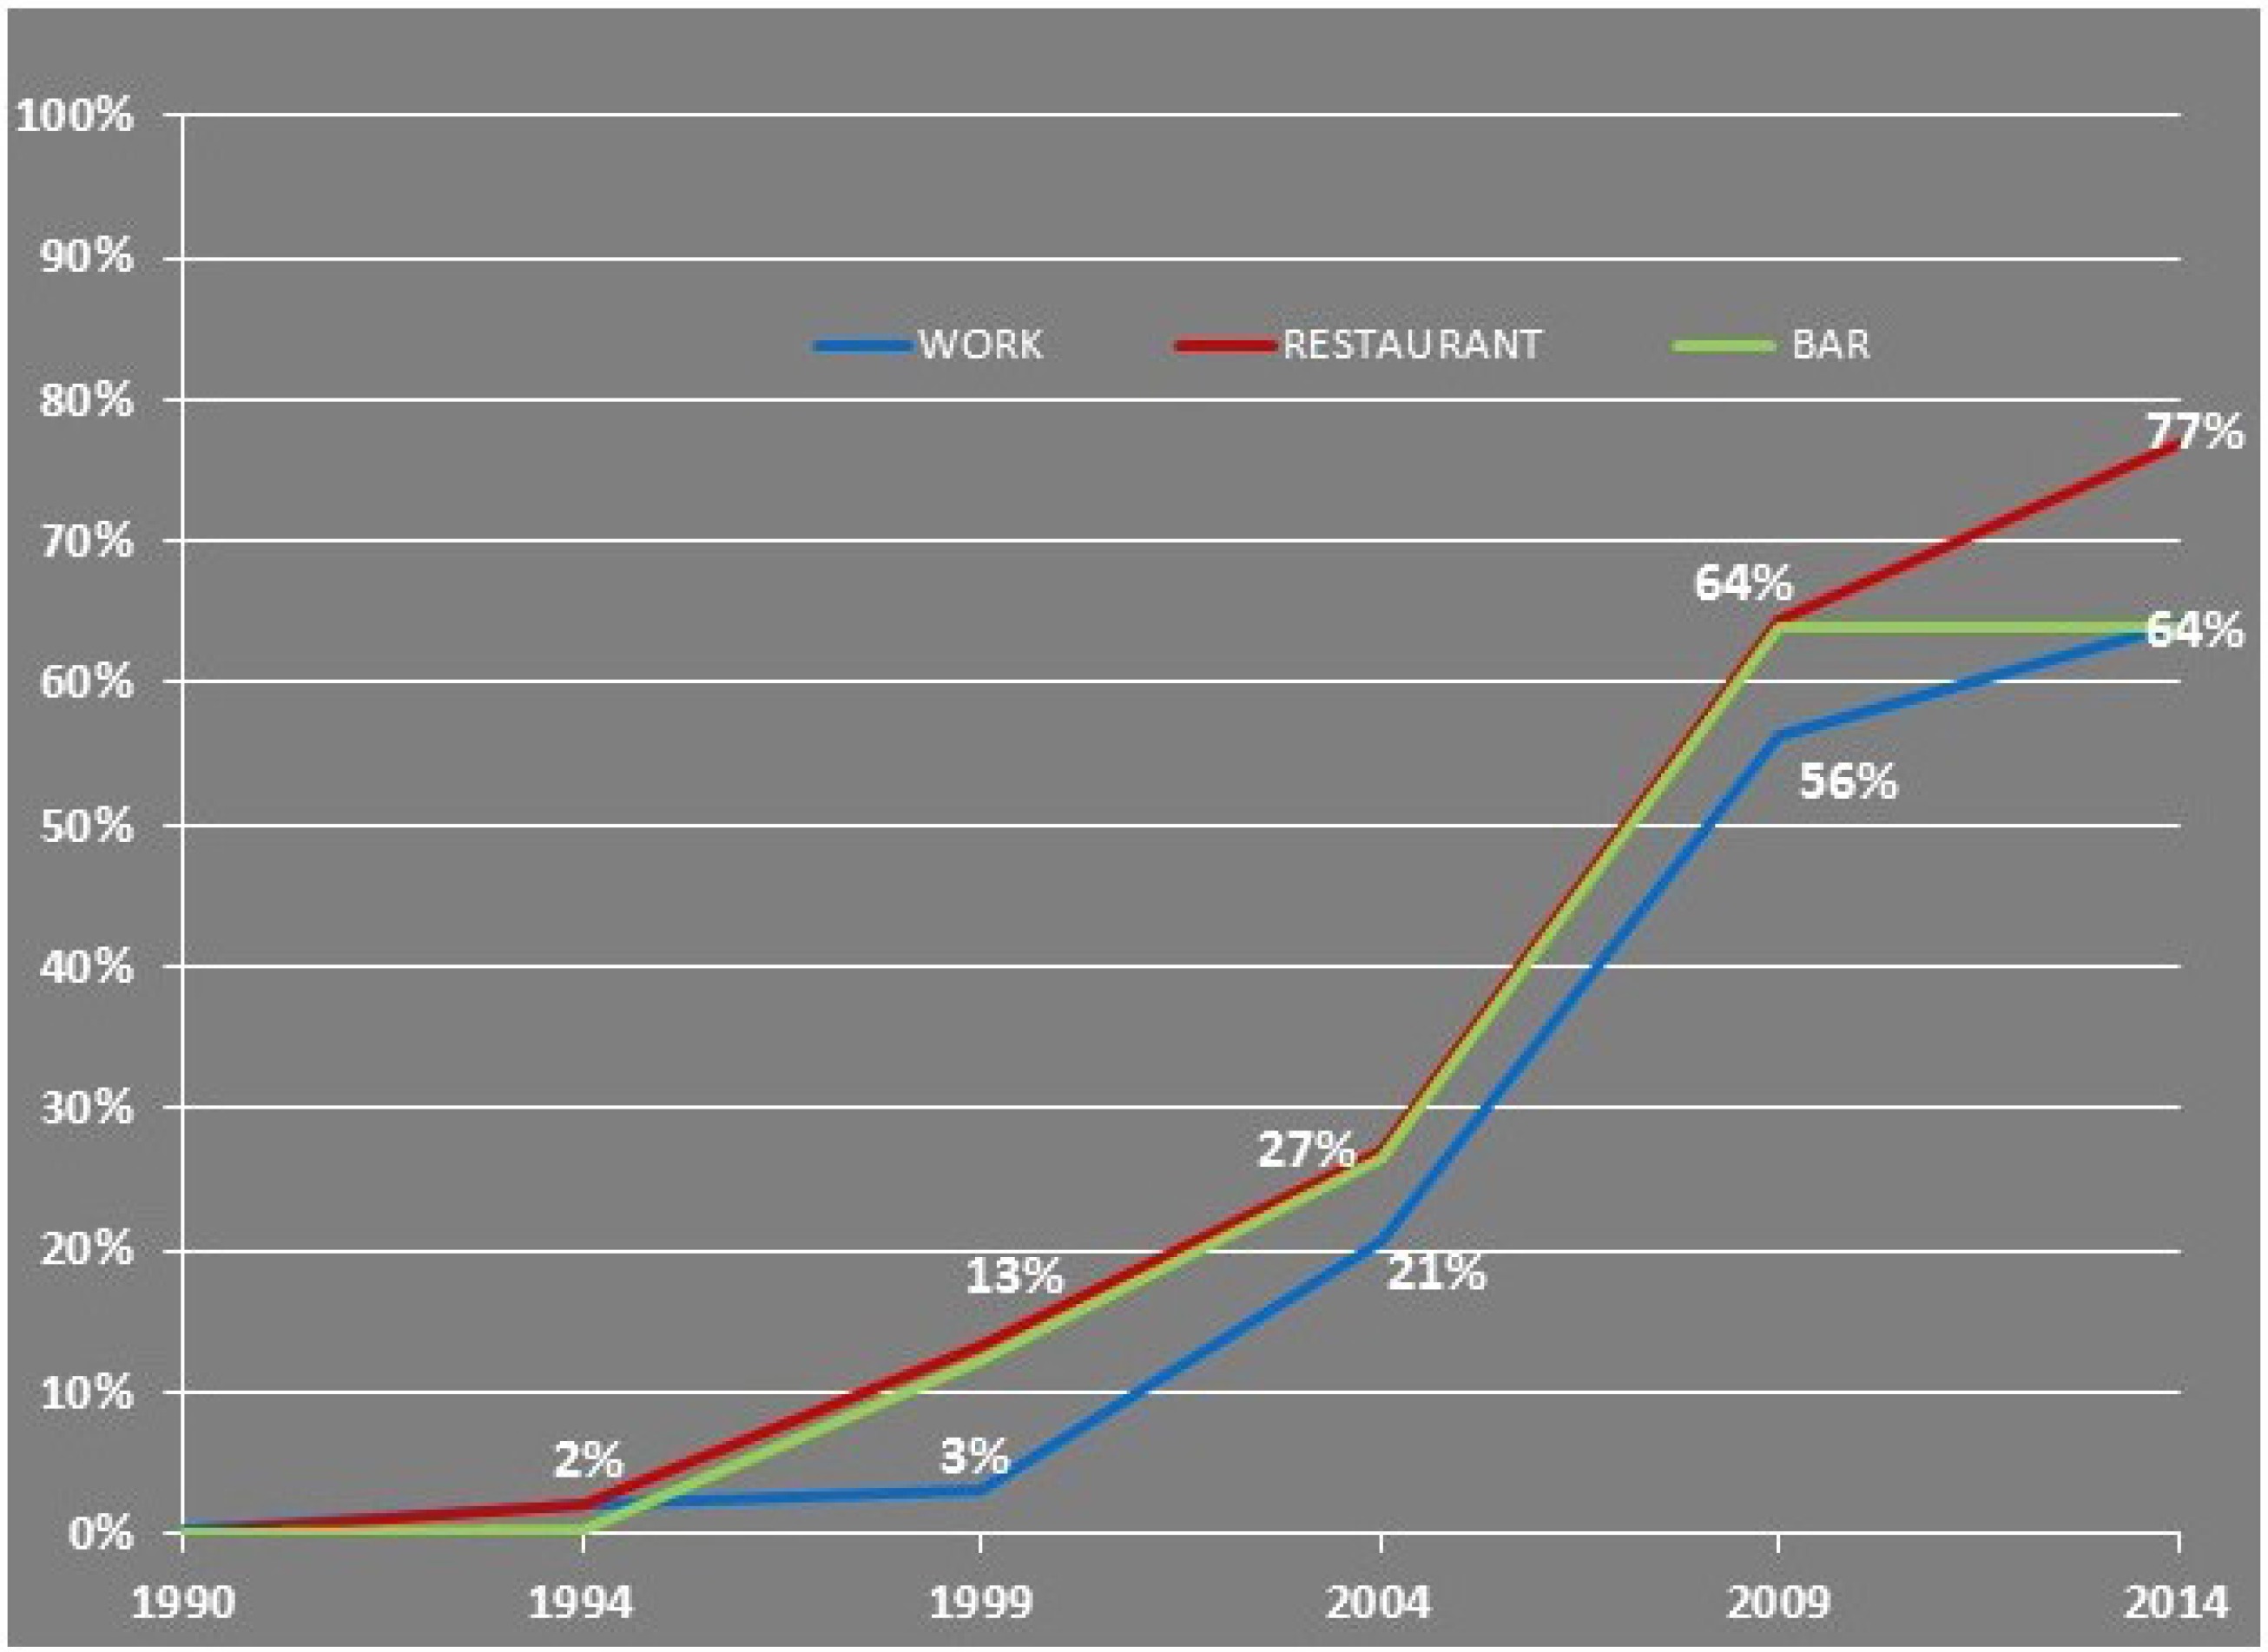
At the National level (Figure 4), from 1990 to 1994, 2% of the U.S. population was covered by smoke-free laws in workplaces (most resided in California, as noted earlier), 2% in restaurants, and 0% in bars. In the subsequent five years, 3% of people in the U.S. were covered by smoke-free laws in workplaces, 13% in restaurants, and 12% in bars. The more widespread adoption of smoke-free laws occurred from 2005 to 2009, when 56% percent of the U.S. population was covered by smoke-free laws in workplaces, 64% in restaurants, and 64% in bars. By the end of 2014, 64% of the U.S. population were covered by smoke-free laws in workplaces, 64% in bars, and 77% in restaurants. In summary, the principal benefit of revealing historical tobacco control coverage patterns was to demonstrate the potential for exploring and analyzing these data at different levels of geography (city, county, State, and region) during different time periods. The next section describes how researchers and public health practitioners can use this information in an interactive environment.
Tobacco-Policy-Viewer
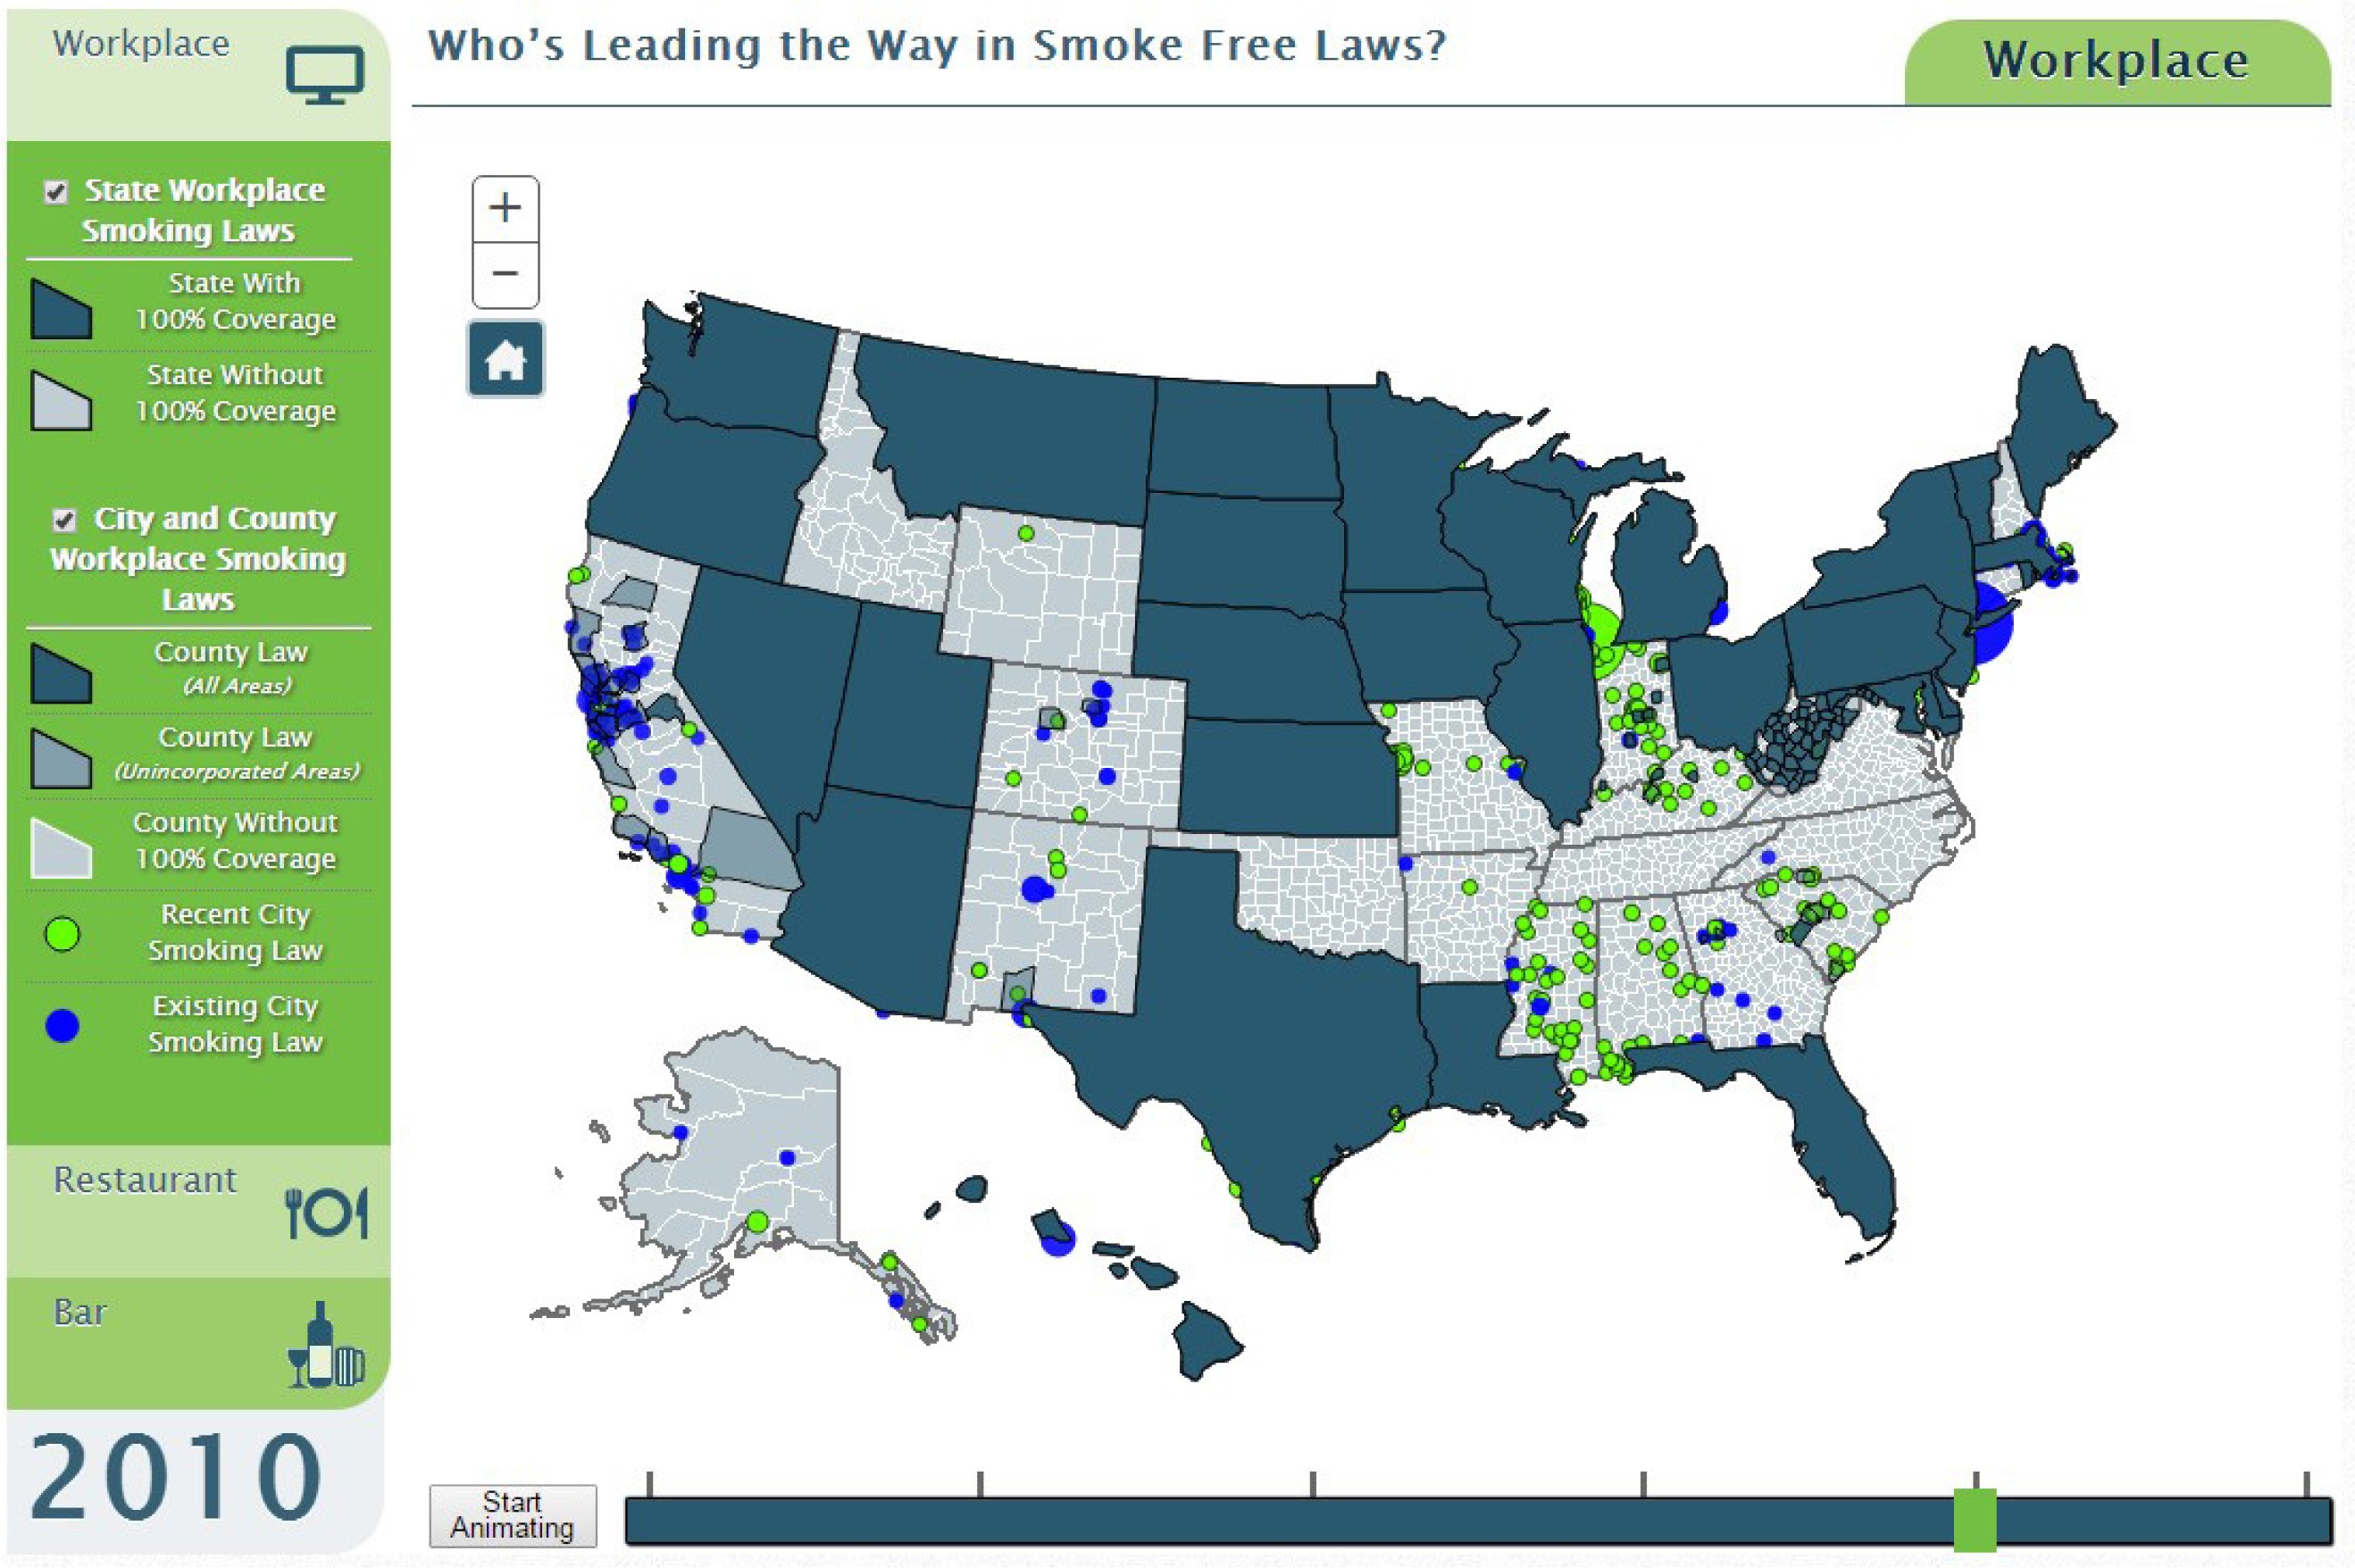
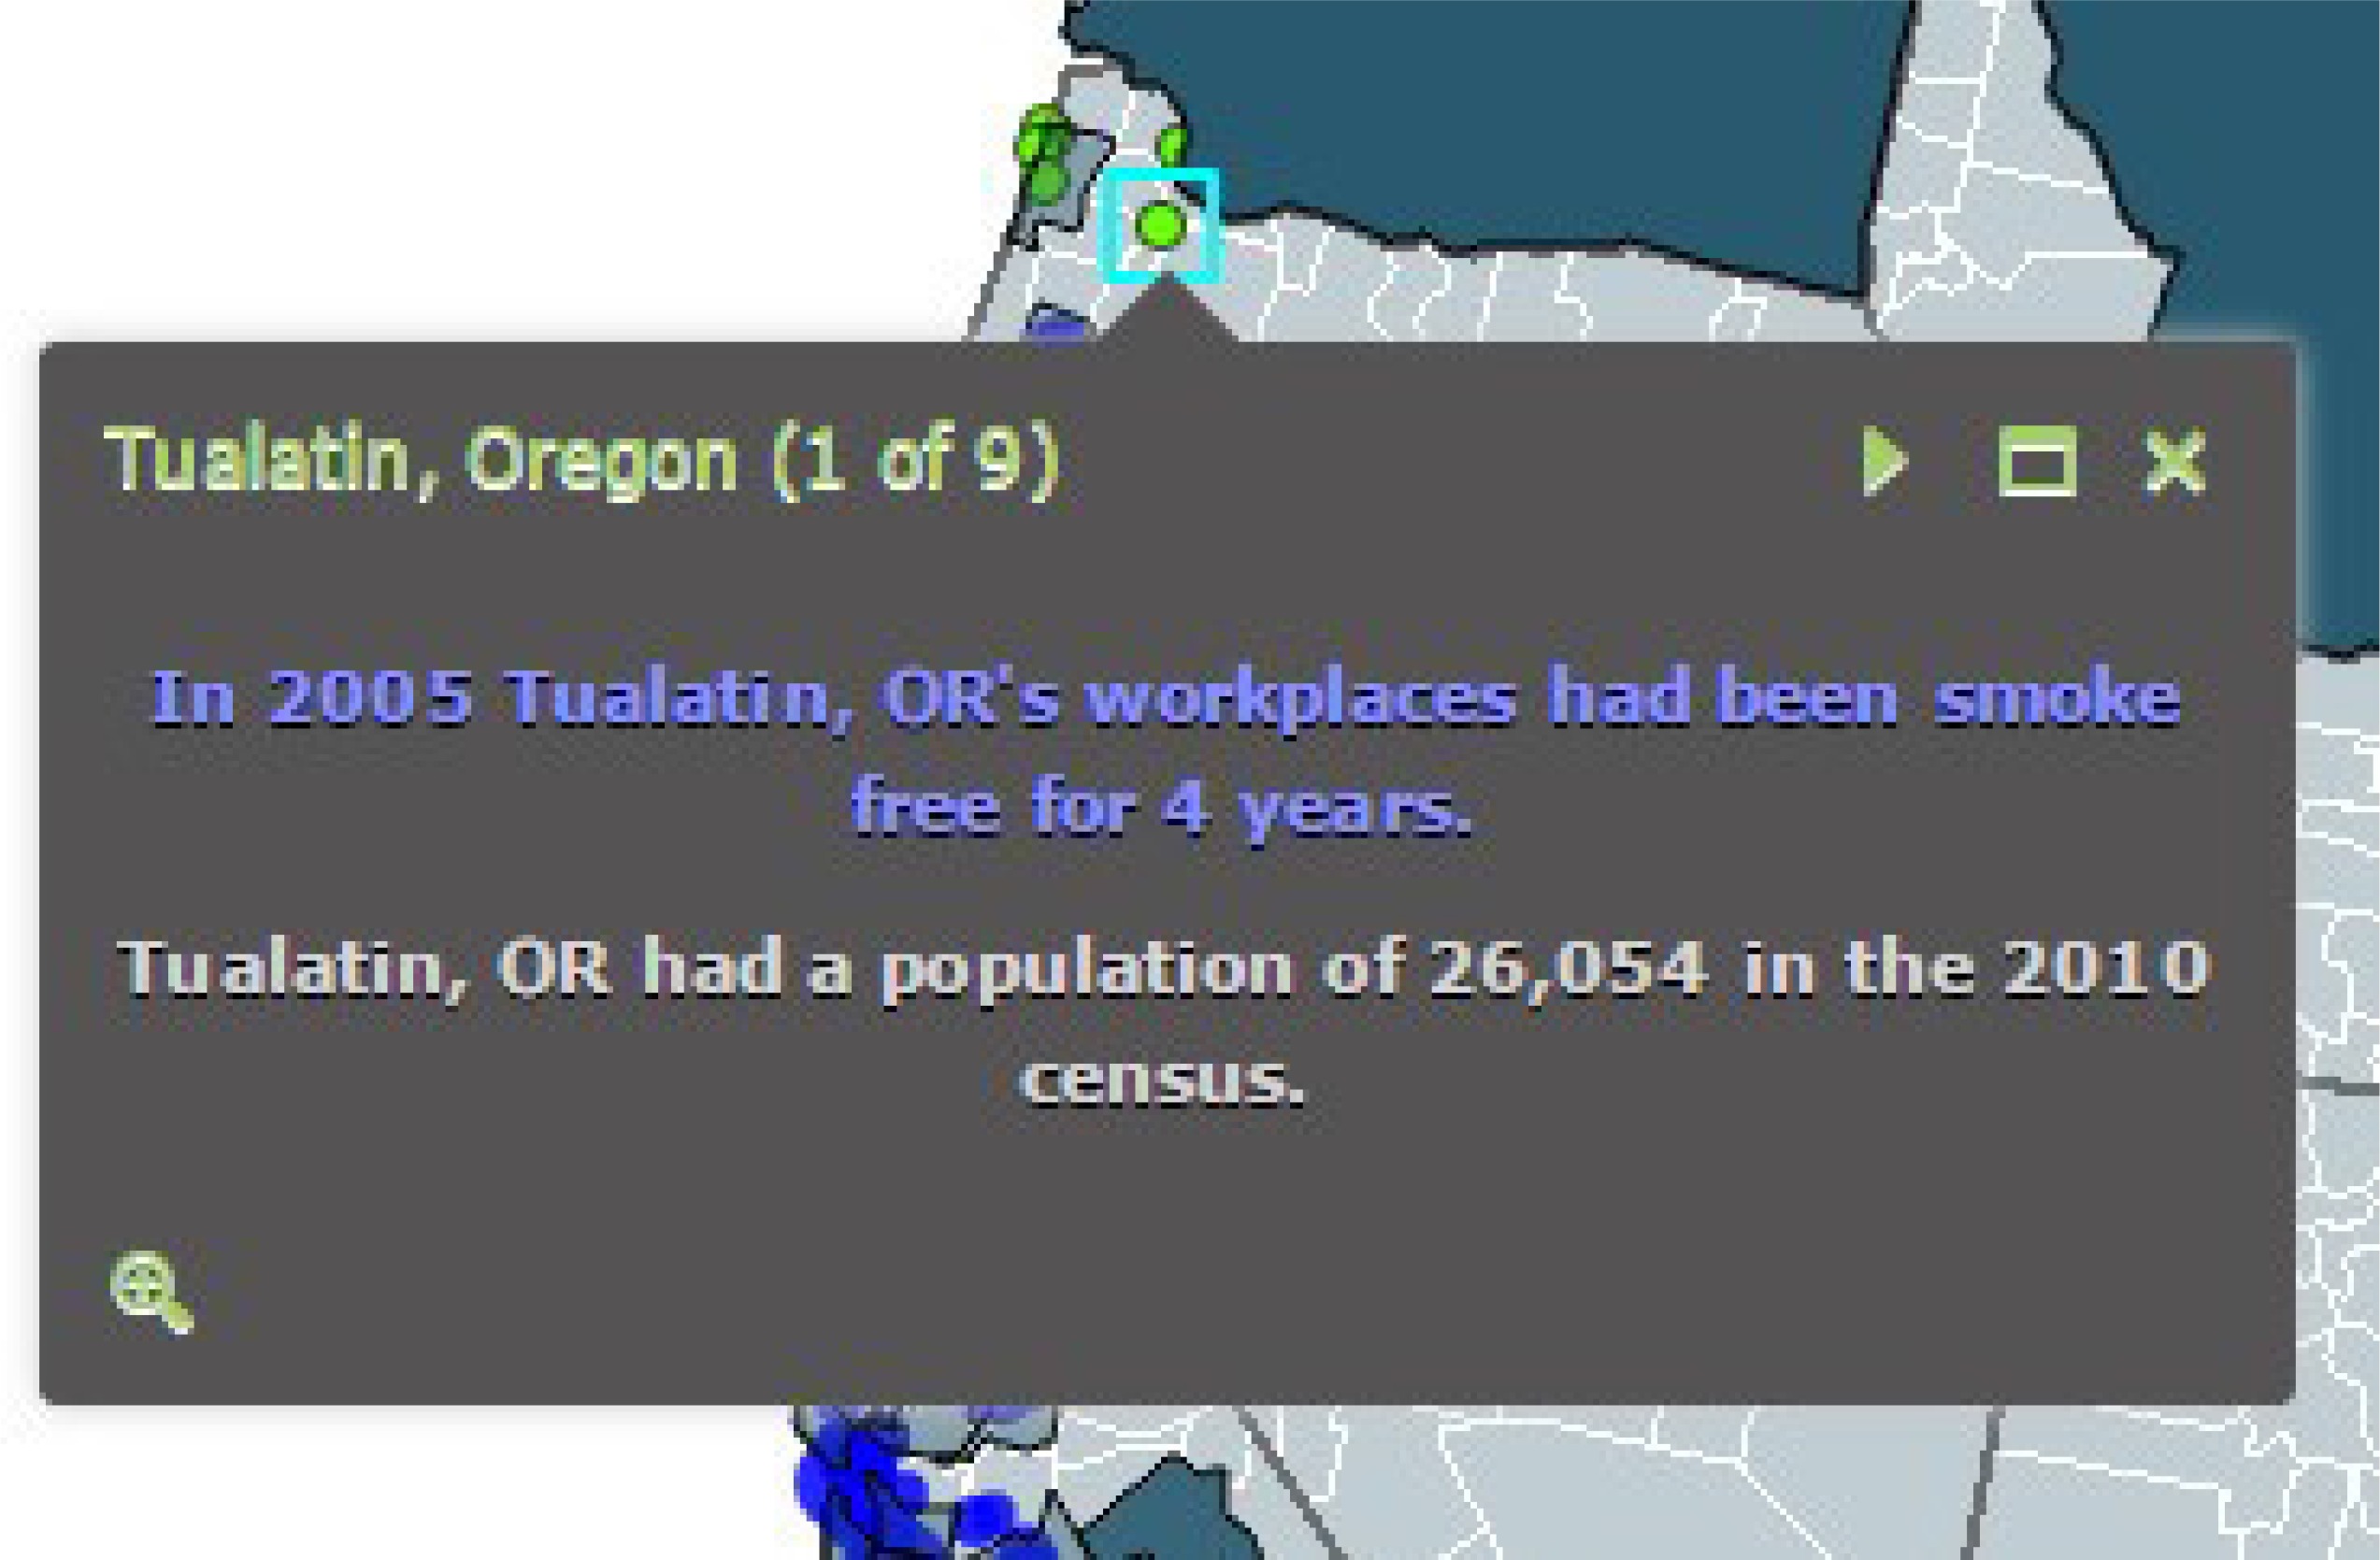
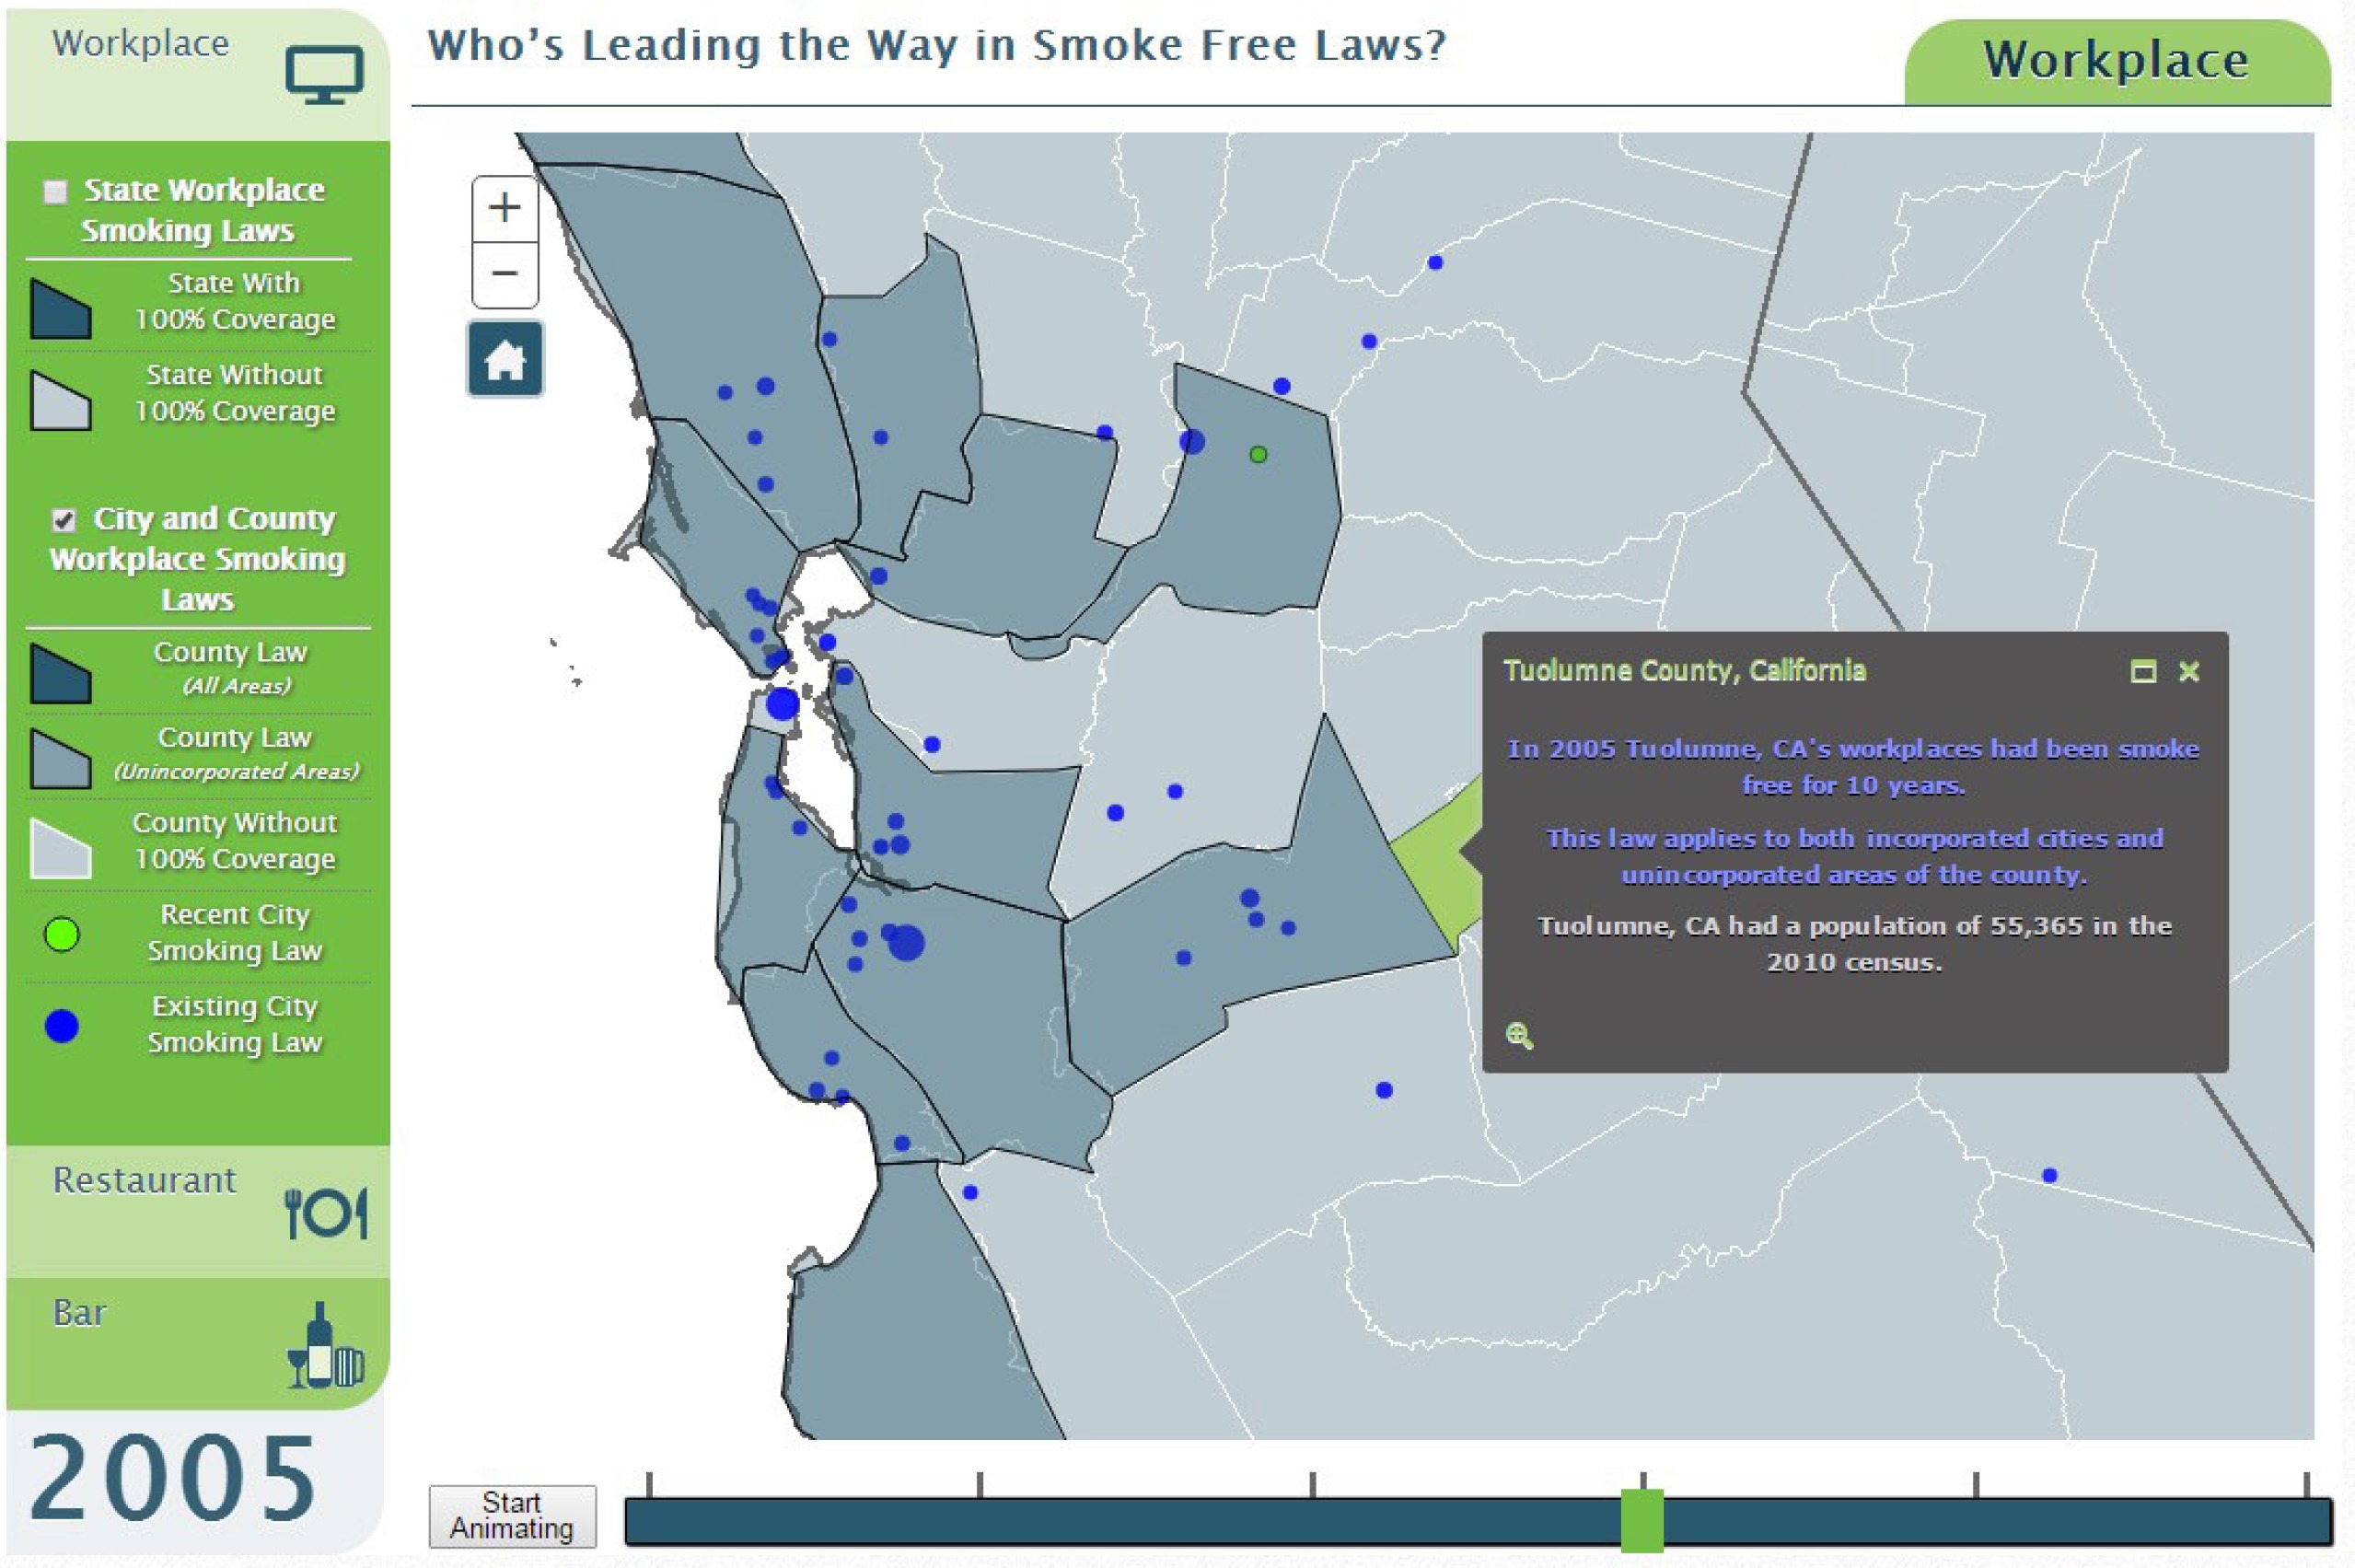
The Tobacco-Policy-Viewer was intended for exploration, visualization, and download of historical smoke-free policy data. The purpose of the tool is to facilitate the targeting of intervention activities by cancer control planners and others, and to catalyze population-based research on health impacts of smoke-free policies. The interactive web-based tool is available at https://gis.cancer.gov/tobaccopolicy , and provides access to the full set of spatiotemporal data on the evolution of smoke-free laws in the U.S., as described in the previous section. Data can be downloaded from the smoking laws landing-page prior to entering the interactive tool. The user interface has been simplified to enable access quickly, and provides the ability to select between data for workplaces, restaurants or bars, for visual display. Users can select the geographic level: city, county, State. Users can click on map features to inspect and display more information like area name, 2010 population and longevity of smoking laws for States, counties, and cities (Figure 5). As cities adopt smoke-free laws, they are shown initially in green, to highlight the changes in the most recent period. States with smoking laws are shown in blue, and cover the county and city features within. County laws are also visualized by blue fill symbols, but have transparency applied to denote when the law applies only to unincorporated areas, not incorporated areas in the county. This allows the user to see city laws that may complement overlaid county laws. If multiple features are nearby, the popup allows the user to page through information about each item while zooming into features, which helps to distinguish them geographically (Figure 6).
Viewers can control the map display by zooming in and out, as well as by panning to center the map on different locations (Figure 7). A ‘home’ button is provided to re-center the map on the continental USA. Animation across time is shown in 5-year increments. This is done because there are many single years when there are no changes in smoke-free policy, particularly in the early years of the history. The animation can be started and stopped, or viewers can click at intervals on the timeline to manually set the displayed time period. It is expected that the tool will continuously grow as new features become available, and data to be updated every 5 years for comparisons over space and time.
DISCUSSION
The goals of this research project were twofold: 1) to characterize cities, counties, States, and Census regions, based on the percentage of population covered and duration of coverage by smoke-free laws in workplaces, restaurants and bars, from 1990 to 2014, and 2) to develop and describe a web-based interactive tool for visualization and download of the U.S. historical smoke-free policy data in a user-friendly format. The overall goal of the project was to provide a comprehensive resource for public health professionals, researchers and the public, on the status of tobacco control laws at Local and regional levels over time. The Tobacco-Policy-Viewer tool can be used to identify populations and locations that are covered (and not covered) by smoke-free laws; the use of this information can possibly assist efforts to expand the coverage of smoke-free legislation locally and regionally.
Limitations
Further work is needed to include other types of smoke-free policy information. Given the new impetus towards smoke-free homes (both legislated and voluntary), including multi-unit housing, this might be a more important direction to go, rather than other perhaps ‘more minor’ routes. In addition, there are smoke-free policies implemented by private businesses and institutions that provide additional protection against secondhand smoke. It might also be useful to track progress of the Tobacco 21 initiative to limit sale of tobacco products to those over 21 years old22. There are also a number of interesting questions that warrant further research. As an example, while the web-based interactive tool provides a means to explore the chronological patterns of smoke-free policy, it is not certain how the tool can best be used to inform policy makers. Similarly, there is a need to further explore how to make this resource useful for evidence-based research to broaden our understanding of the relationship between tobacco prevention and control efforts, smoking behavior, exposure to secondhand smoke, and tobacco-related health outcomes, as well as exploring how resources such as tobacco tax rates, media campaigns, etc. can be used for various types of economic analyses.
CONCLUSIONS
The utility of visualizing the historical patterns of smoke-free policy coverage in the U.S. is to understand where and for how long were people smoke-free in indoor facilities, and provide information for planning the education and interventions in the areas of need. The benefit of data provided for download via Tobacco-Policy-Viewer is to catalyze future research on the impacts of historical smoke-free policy coverage on reduction in secondhand-smoke exposures, tobacco use, and tobacco related diseases.