
INTRODUCTION
An overwhelming body of research has linked tobacco consumption to numerous disease conditions1-3. It is a major risk factor for cancers, emphysema, chronic obstructive pulmonary diseases and the leading cause of avoidable diseases4-6. Also, the occurrences of miscarriages, premature births, low birth weight, sudden infant deaths syndrome and erectile dysfunction have been found to increase with tobacco use7-11. Smoking presents an extremely high risk of premature death compared to other modifiable health risk behaviours. It is expected that more than 50% of long-term smokers will likely eventually die in their productive middle-age as a result of the health consequences of the chemicals in tobacco12. In 2010 alone, there were about 5.7 million tobacco related deaths, globally13. Although, the prevalence of tobacco use has decreased in developed countries, this decline has been compensated by an increase in low-and-middle-income countries (LMIC). Of the over 1.1 billion current smokers globally in 2019, about 880 million live in developing countries14. Despite the already enormous double burden of communicable and non-communicable diseases in LMICs, these countries face an increased risk of higher burden of tobacco-related health conditions in the future. A study projected that a disproportionate 6.8 million out of 8.3 million global deaths are likely to occur in LMICs by 203015.
United Nations data on global consumption revealed that about 1.79 billion ₦ (Nigerian Naira, about 11.9 million US$) were spent on tobacco consumption in Nigeria in 2010 alone16. More so, adult smoking was reported to be 9%, with 9.7% for teenage boys and 5.7% for teenage girls in Nigeria in 201017. Likewise, the World Health Organization (WHO) estimated tobacco use in men and women in Nigeria at 10% and 2%, respectively, in 201118. Worse still, adult smoking rose to 13.7% of the total population in 201517.
To control the use of tobacco products, WHO through its Framework Convention on Tobacco Control (FCTC) recommended a set of ‘best buys’ policy interventions. These measures include the use of the economic tool, i.e. regular increase excise taxes on tobacco products, as well as a wide range of legislative measures (imposition of large graphical health warnings on all tobacco packages; enforcement of comprehensive ban on all forms of tobacco advertising, promotions and sponsorship; restriction of smoking in indoor work and public places, and on public transport etc.)19-21.
Studies have shown that raising the price of tobacco products presents a huge potential for reducing the prevalence and incidence of tobacco use globally. The extent of this impact is often captured using price elasticity of tobacco demand. Although, the reported price elasticity of tobacco demand in the literature varies, there is consensus regarding the range. For instance, Czubek and Johal22, calibrated a number of models estimating the price elasticity of duty-paid cigarettes in the United Kingdom and reported that the degree of responsiveness of tobacco demand to increases in tobacco taxes ranged between -0.17 and -0.92. Also, a number of other studies23-29 conducted reported values between -0.15 and -0.72. Gibson and Kim30 estimated the price elasticity of tobacco products with a focus on quantity and quality margins. Their study suggests that price elasticity of quality represents about two-thirds (-0.67) of the overall response due to quality shading, whereas one-third (-0.33) was accounted by price elasticity of quantity, particularly when analyzing household survey and when unit value is used as proxy for price30. Generally, socioeconomic status has been found to be a major determinant of how strongly smokers respond to price increases, as poorer smokers are more responsive to price changes compared with economically viable smokers26,31.
Tobacco use and trade in Nigeria
According to the Global Adult Tobacco Survey (GATS) conducted in 2012 in Nigeria, the level of tobacco consumption was the highest in the Southeast region (9.1%) and the lowest in the Northwest region (2.7%) of the country. The prevalence for the entire country was 5.6%, which represents about 9.21 million users of tobacco products in 2012. Given that GATS 2012 is the latest survey of the level of tobacco use in Nigeria, it is unclear whether the prevalence of tobacco use has progressed or decreased as at 2019. However, some reports have shown that given the level of efforts to control tobacco use in Nigeria, the level of its use might keep increasing with the population level18.
Exposure to secondhand smoke is regarded as passive/involuntary smoking and as such can be seen as a form of tobacco use (and also constitutes negative externality). The GATS survey revealed that the proportion of individuals exposed to secondhand smoke (mainly in restaurants and some public places) in the Southeast region of Nigeria was 50.3% in 2012. The level of exposure in North-Central Nigeria was 27.8% while this was about the same for Northeast and Northwest (27.5%). Exposure to secondhand smoke nationally was slightly higher at 29.3% (this represents about 6.4 million adults that were exposed to secondhand smoke during the period under review). Given the reported health effects posed by exposure to secondhand smoke to population and public health, these statistics reaffirm that the threat posed by tobacco use may be rising in the country.
In the GATS, average monthly expenditure on manufactured cigarettes was elicited and revealed that smokers in North-Central and South-South spent more (₦3791.9 and ₦2540.8, respectively) on the average compared with smokers in the other regions of the country. The average monthly expenditure on manufactured cigarettes was lower in the Northeast (₦1274.5) compared with that of a typical smoker in the Southeast (₦1806.3). National estimates show that smokers spent ₦ 1202.5 on manufactured cigarettes in 2012. The differentials in the average monetary outlay by smokers on manufactured cigarettes can be a result of differentials in the price of various brands across regions in the country. Also, some smokers might be smoking higher quality brands that usually have higher prices.
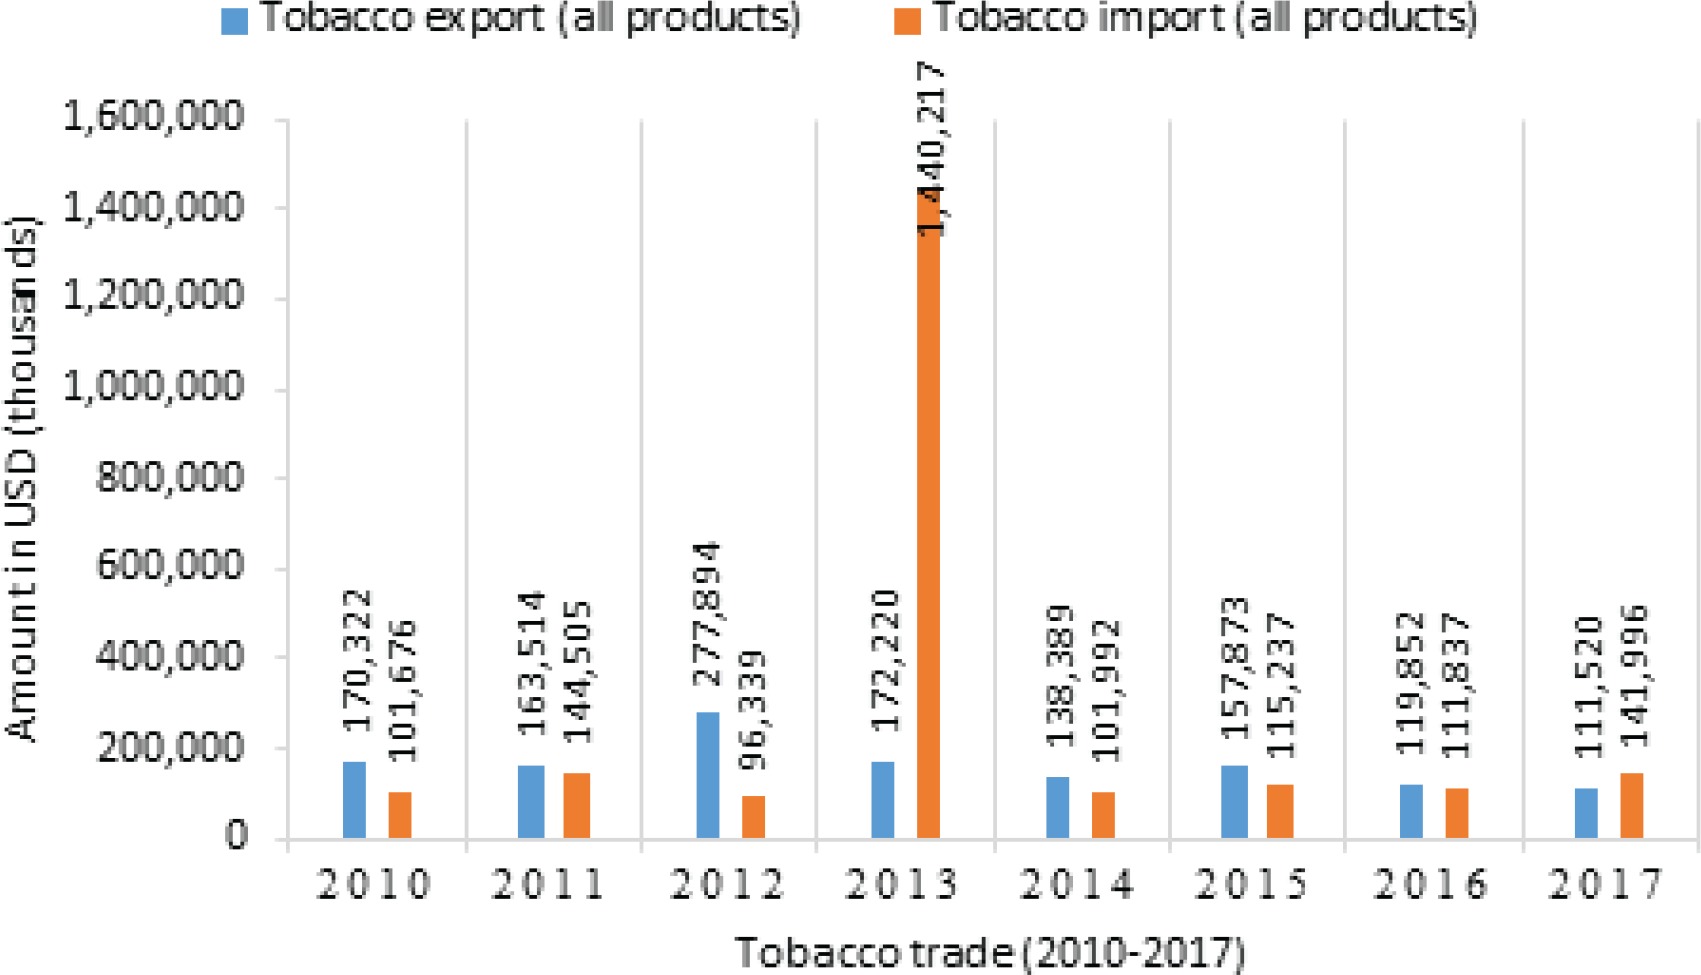
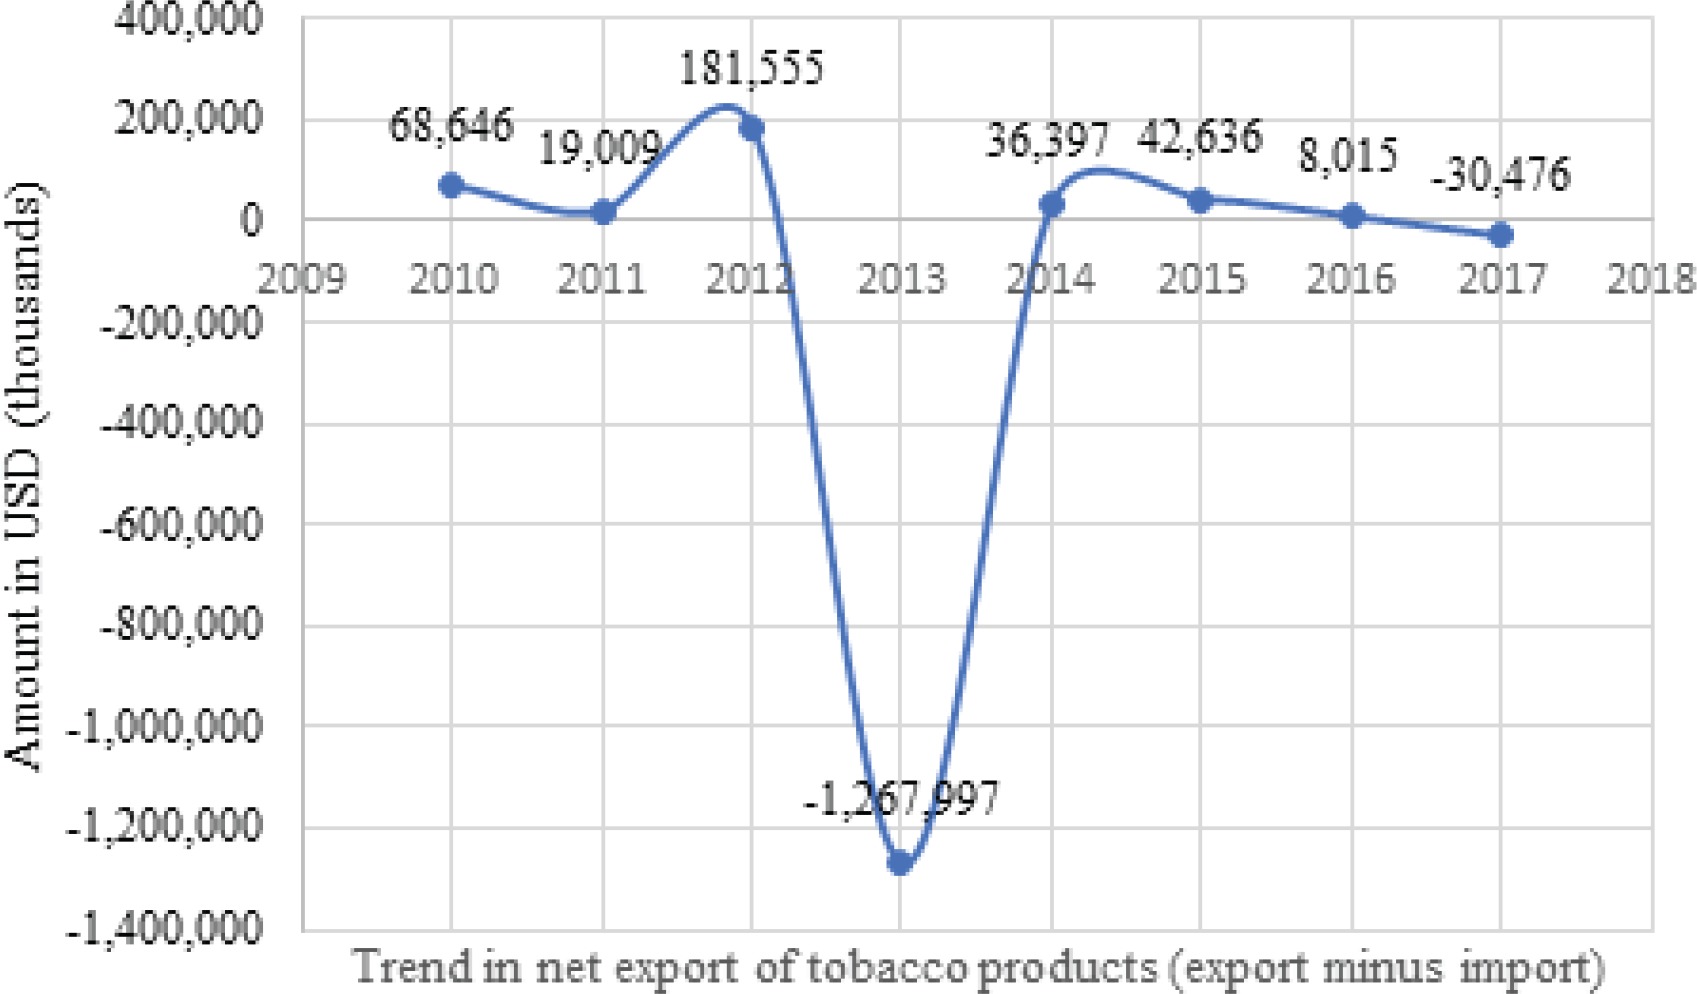
Figure 1 shows exports and imports of all tobacco products: cigarettes (of tobacco or of tobacco substitutes), cigars, cigarillos, and unmanufactured tobacco, tobacco refuse) from 2010–201732. The value of exports surpassed that of imports of all tobacco products between 2010 and 2012. The trend changed from 2013–2015 when negative net export was experienced. This was the highest in 2013 as import value surged above export by 1.269 billion US$ (the highest within the period under review). In 2016, a positive net export was attained by the Nigerian tobacco industry, but the situation reversed again in 2017. The movement in net export of all tobacco products in Nigeria from 2010–2017 is depicted in Figure 2. This trend is typical of a business cycle (also called economic or trade cycle) with upward (peaks) and downward movements (troughs). As shown in Figure 2, the period between 2012 and 2014 had a bell-like shape, representing an enormous negative export (with a difference of -1.27 billion US$). In general, this trend was fairly stable after 2014. There was a positive net export prior to 2013 and the volume of export recovered in 2014 before falling again in 2017.
Nigeria ratified the WHO FCTC in 2005, however, studies that assessed the impact of excise tax on tobacco products are few. Meanwhile, research has shown that increases in excise taxes remains the most effective tool for tobacco control22-24. In general, optimal taxation of tobacco products represents vital input in the formulation of tobacco control policies globally, as proposed in the WHO FCTC through the MPOWER measures.
As such, this study estimates the consumption function and price elasticity of tobacco demand in Nigeria. This is with the aim that findings from the study will provide further evidence for developing optimal tobacco excise taxation in Nigeria.
METHODS
Data
The data for this study were drawn from the Harmonised Nigerian Living Standard Survey (HNLSS) conducted in 2009–2010 by the National Bureau of Statistics (NBS). The HNLSS survey collected broad information on demographics, health and fertility behavior, education and skill training, employment and time-use, household income, consumption and expenditure on a broad category of commodities including tobacco products (NBS, 2012). This survey adopted the Enumerated Areas (EAs), otherwise referred to as clusters that were demarcated by the National Population Commission during the 2006 Housing and Population Census. The sampling frame of the survey included all the 774 local government areas in the 36 states of Nigeria and the Federal Capital Territory (FCT). A two-stage sampling design was used to systematically select 100 households in each local government area from the primary sampling units (PSUs) for part A of the survey, and 50 households were systematically selected from each local government area in part B. Part A contained a welfare component while part B elicited information on household consumption and expenditure. Altogether, 77400 households were enrolled for the study. The B component (the consumption approach) of the survey included 38700 households that were nationally representative.
There are two data requirements for the computation of unit values, but in the HNLSS only expenditure on tobacco consumption was reported. Therefore, the mean quantity consumed by households reported in the GATS conducted in 2012 was used. The GATS collected information on participants sociodemographics as well as a range of information regarding tobacco use, both smoked and smokeless, cessation, secondhand smoke etc. Detailed information regarding the data can be found elsewhere33.
Theoretical framework
In economics, the theory of demand relates the quantity of goods demanded to their prices. Following the work of Wilkins et al.34, the conventional tobacco consumption function can be expressed as:

Equation 1 expresses tobacco consumption (TCd) as a function of the price of tobacco (P), prices of other social goods, denoted by a price aggregator (Π), total household income (Y), household taste T (whether to smoke or not), and a vector of legislative restriction on tobacco use (LR). Differentiating Equation 1 with respect to price (P) will give the unit change in TCd due to change in price. Thus, the price elasticity of tobacco consumption is defined as:

Empirical model
Estimation of consumption function and price elasticity of tobacco demand
To estimate tobacco consumption function, a system of demand equation was specified. Also, the methodology proposed by Deaton35 was adopted to estimate the price elasticity of tobacco demand, given the cross-sectional nature of the data used for the study. The Deaton methodology was adopted to leverage on ‘spatial price variation’ across clusters (or villages) in the absence of price data, to estimate the percentage change in quantity demanded with respect to changes in unit values across clusters. Deaton’s methodology has two underlying assumptions. First, it assumes that there are constant within-cluster commodity prices. Second, there is variation in prices across clusters, referred to as variation in between-cluster prices. In effect, cluster means of commodity prices can be regressed against cluster means of quantities to estimate price elasticity of demand. However, given that household expenditure surveys conducted in most developing countries usually do not collect price data, the methodology requires that ‘unit value’ (the ratio of total/group expenditure Ei and group quantity demanded) be used as proxy for the price of commodities. Following the work Chelwa and van Walbeek25, two models are specified thus:


The demand system depicted in Equation 3 is the tobacco consumption function (a Quadratic Almost Ideal Demand System) and ωic denotes the share of tobacco consumption expenditure in total household expenditure Eic of household i residing in cluster c. Equation 4 is the unit value equation and lnvic is the log of unit value. The terms, lnEic and (lnEic)2 are log of total household expenditure and the square of the log of household total expenditure (smokers only), respectively. The budget share and the unit value are functions of total household expenditure, a vector of household demographic characteristics (a) and the logarithm of N price (Pc). The term fc is the food price index, which captures variation across clusters and the same for households residing within the same cluster. In Equations 3 and 4, u1ic and u2ic represent the stochastic error terms. The price Pc is not observable but associated with unit value (vic= pttic/qic).
Equations 3 and 4 were estimated and the coefficient of log total household expenditure was employed to control for the effect of tobacco expenditure and household demographics on household budget share of tobacco consumption and the unit value. Afterwards, the mean of budget shares was computed. The unit values of smoking households residing in the same cluster is depicted thus:


Equations 5 and 6 give the quantities,  , and unit values,
  , controlled for the effects of household expenditure and household demographics. Also, nh is the number of smoking households, which represent a subset of households in cluster c. The purging is done so as to correct for the effect of household income on budget share (demand) and unit values. This allowed this study to exploit unit values from tobacco consumption and thereby separate quality choice from exogenous price variations. In effect, was regressed on so that the coefficient obtained was denoted as φ. Finally, the following formula popularized by Deaton and used in the work of Chelwa and van Walbeek25 was adopted to derive the price elasticity of tobacco demand:

Where wi denotes the average total household tobacco expenditure, and  2i and
  1i, generated from Equations 3 and 4, denote the coefficients of the unobserved price and are given by:


Where  and
and  are the coefficients of the budget share Equation 3 and unit value Equation 4, and φ was the estimate generated when
  was regressed on
  .
.
This methodological approach was criticized by Gibson and Kim30 on the grounds that it overestimates the price elasticity of tobacco demand as a result of failing to fully control for quality responses to increase in price. They instead proposed the use of an unrestricted model. However, the unrestricted model requires price data, not available in the HNLSS 2009–2010. As such, the Deaton model remains the most appropriate methodology for estimating price elasticity of tobacco products when analysing cross-sectional survey data, which usually do not include price data.
RESULTS
Table 1 shows the descriptive statistics of relevant variables in the data. The mean household size was 4.42±2.51 and mean age of household head was 47.65±16.02 years. Also, the average years of schooling/education was 9.75±3.83 years. The mean food price index (FPI) was 1.03±0.19. Household expenditure was reported in Nigerian Naira (₦).
Table 1
Descriptive statistics of households, HNLSS 2009–2010, Nigeria
| Variable | Mean | SD | Min | Max |
|---|---|---|---|---|
| Household size | 4.42 | 2.51 | 1 | 10 |
| Age of household head (years) | 47.65 | 16.02 | 15 | 95 |
| Education of household head (years) | 9.75 | 3.83 | 6 | 16 |
| Food price index | 1.03 | 0.19 | 0.66 | 1.80 |
| Household expenditure* (million ₦=) | 1.90 | 9.19 | 0.0063 | 9700 |
| Per capita expenditure* (million ₦=) | 0.497 | 23.60 | 0.0016 | 2900 |
| Number of households | 34769 | |||
| Number of smoking households | 505 | |||
| Number of clusters | 91 | |||
| Mean number of households per cluster | 382 | |||
| Percentage of males in households | 84.78 |
The average exchange rate at the time of the HNLSS 2009–2010 was ₦163 to $1. Mean household yearly expenditure was 1.9±91.9 million ₦. Reported household expenditure showed a wide spread which is reflected in the reported range. There were 34769 households out of which 505 used tobacco. This presupposes that the prevalence of tobacco use was low among households. However, earlier studies reported much higher prevalence of tobacco use among households in Nigeria14,33. There were 91 clusters and the average number of households per cluster was 382. The majority of the households (84.78%) were headed by males.
Table 2 presents estimates from the tobacco consumption function and unit value models in Equations 3 and 4. In the budget share regression, household size, location, household total expenditure and food price index were significant determinants of tobacco use in the full sample (all households with at least one individual who consumed tobacco). However, in rural and urban samples, only household expenditure and food price index were significant covariates. The coefficient of household expenditure is negative and statistically significant in all the samples (full, rural and urban). This may suggest that when income increases, the share of tobacco in household budgets declines, which does not necessarily mean a reduction in the consumption of tobacco. This result is similar to those of earlier studies. Pesko et al.29 estimated the price elasticity of tobacco products in India. Using unit value to proxy the prices of the various tobacco products consumed, they estimated the budget share of tobacco and showed that household expenditure was a significant covariate. However, the coefficient on the log of total household expenditure was positive showing that for tobacco using households, smoking increased as expenditure increased.
Table 2
Estimates of tobacco consumption function and unit value equation, Nigeria
| Variables | Full | Rural | Urban |
|---|---|---|---|
| Budget share | |||
| HHsize | -0.1450* [0.0776] | -0.1309 [0.0799] | -0.1279 [0.1791] |
| HHage | -0.1065 [0.1493] | -0.1080 [0.1437] | -0.1716 [0.4179] |
| HHedu | -0.0054 [0.1069] | -0.0776 [0.1363] | 0.2983 [0.1853] |
| Urban | -0.2544 [0.1766] | ||
| InE | -0.5252*** [0.0681] | -0.5259*** [0.0655] | -0.5655** [0.2118] |
| Food price index | -2.5887*** [0.6260] | -2.2455*** [0.6365] | -4.1160*** [0.9117] |
| Constant | 2.8190*** [0.9154] | 2.8067*** [0.9458] | 3.1626 [2.5635] |
| Number of households | 505 | 418 | 87 |
| F-stat | 31.07*** | 30.11*** | 6.05*** |
| R-squared | 0.2962 | 0.2777 | 0.4046 |
| Unit value | |||
| HHsize | -0.1483* [0.0793] | -0.1337 [0.0818] | -0.1348 [0.1823] |
| HHage | -0.1083 [0.1540] | -0.1098 [0.1496] | -0.1722 [0.4224] |
| HHedu | -0.0051 [0.1092] | -0.0782 [0.1392] | 0.3022 [0.1868] |
| Urban | -0.2638 [0.1788] | ||
| InE | 0.4672*** [0.0685] | 0.4661*** [0.0660] | 0.4332* [0.2129] |
| Food price index | -2.6610*** [0.6393] | -2.3197*** [0.6527] | -4.1755*** [0.9254] |
| Constant | -5.0236*** [0.9298] | -5.0298*** [0.9652] | -4.7697* [2.5810] |
| Number of households | 505 | 418 | 87 |
| F-stat | 17.25*** | 28.28*** | 7.24*** |
| R-squared | 0.1825 | 0.1599 | 0.351 |
While this result is consistent with economic theory where for a normal good, quantity consumed increases as income increases ceteris paribus, Chelwa and van Walbeek25 estimated the tobacco consumption function for Uganda and found household expenditure had a negative effect on tobacco spending/consumption. Since household expenditure remains the most preferred proxy for household income in economics literature, this result could also mean that households with lower income smoked more compared to higher income households. For instance, several studies have found that poor individuals/households are more likely to smoke compared to rich individuals/households. Palipudi et al.31 conducted a study on the impact of tobacco consumption on the poor in Bangladesh. Their study revealed that economically deprived persons/households were twice as likely to smoke compared to rich households.
Table 2 also shows that covariates such as age and level of education of household head were not significant in explaining tobacco use/consumption. The R-squared statistic for full, urban and rural samples (0.2962, 0.2777 and 0.4046, respectively) in this study showed that there are other factors that are not included in the model but associated with tobacco consumption in Nigeria. In the urban sample, only about 40% of the variation in smoking behaviour was explained by the covariates in the model. This is different from findings in the earlier studies conducted in developing countries30,32. These studies revealed that covariates such as household income/expenditure, household size, cluster level effects (prices and tastes/preferences) explain over 80% of tobacco consumption behaviour among smoking households30,32. Overall, this study revealed that household size, household total expenditure and food price index are significant predictors of tobacco consumption in Nigeria.
Other covariates not captured in the model (tobacco consumption function) that have been strongly linked with tobacco consumption are social factors such as peer pressure and smoker background (i.e. the influence of smoking behaviour of parents or close family members on children). For example, WHO33 carried out a study that investigated the impact of parenting behaviour on the onset of tobacco and alcohol use. A strong link between these two variables was found. However, the data used for the present study did not elicit information on respondents’ background regarding parental tobacco use and this prevented the inclusion of this variable in the tobacco consumption function. Another possible cause of the low predictive power of the tobacco consumption model could be a result of the degree of variability exhibited in the data used for the study. In the statistical literature, the predictive power of models has been found to be impacted on by data sets that exhibit a high degree of variability34.
In the unit value regression, the covariates showed a similar pattern to the one revealed in the tobacco consumption model. Household size, household total expenditure and food price index were significant covariates in the model full sample. But in rural and urban sub-samples, household expenditure as well as food price index were the only significant variables. Deaton35 found evidence that supports this finding. In that study, cross-sectional data for developing countries were analysed and results showed that household expenditure and cluster fixed effects are significantly associated with unit value.
Table 3 shows statistically significant conditional price elasticity of tobacco demand (the price elasticity of tobacco demand here was estimated for tobacco consuming households, i.e. conditional on the consumption of tobacco products) for full (-0.62), rural (-0.63) and urban (-0.49) samples in Nigeria. This reveals that the demand for tobacco is fairly price inelastic. The statistics, conditional price elasticity of tobacco demand and the standard errors (the standard errors for the bootstrap statistics were estimated using the standard deviation of the bootstrap distribution, 1000 replication of the bootstrap)35 were generated from bootstrap samples. In classic economics, the estimated price elasticity means that for every increase in the price of tobacco, the quantity demanded falls but less than proportionate to the increase in price. For instance, these estimates show that for every, say 5% increase in the price of tobacco, there will be a corresponding reduction of about 3% in the quantity of tobacco demanded in the full and rural samples.
Table 3
Conditional price elasticity of tobacco demand, Nigeria
| Statistic | Full | Rural | Urban |
|---|---|---|---|
| -0.6247*** | -0.6331*** | -0.4895*** | |
| ÊP | [0.0028] | [0.0035] | [0.0247] |
| (-0.6301, -0.6192) | (-0.6401, -0.6262) | (-0.5387, -0.4403) | |
| Number of households | 505 | 418 | 87 |
The table gives price elasticity of tobacco demand (the effect of change in unit value/price on the quantity of tobacco demanded) with corresponding standard error in square brackets and 95% confidence interval in parenthesis. These statistics are generated from bootstrap samples. Statistical significance:
However, the corresponding reduction in the quantity of tobacco demanded in the urban sample (among smokers living in urban centres) will be about 2%. In this case, the tobacco industry/manufacturers are able to pass a substantial proportion of any increase in the excise tax of tobacco products to the consumers. This result is found to be supported by nearly all the studies on the price elasticity of tobacco products in developing countries and in some developed countries.
DISCUSSION
This study estimated the tobacco consumption function and revealed that household size, food price index, level of education/literacy of household head and income were significant determinants of tobacco consumption in Nigeria. Also, budget shares (QUAIDS) and unit value equations that allow for spatial variation in prices and quantities demanded were estimated to determine the price elasticity of tobacco demand in Nigeria.
A review of the taxation of tobacco products in developing countries conducted by Chaloupka et al.36 revealed that price elasticity of tobacco products had minimum and maximum values of -0.50 and -1.00. But the estimates from developed countries revealed higher values between -0.25 and -0.50, indicating that higher income smokers are likely to be less responsive to increases in the prices compared to lower income smokers. In fact, many other studies have found that poorer smokers are more responsive to increases in the price of tobacco products. This also means that excise taxes on tobacco products is progressive.
Likewise, Eozenou and Fishburn24 estimated the price elasticity of cigarette demand in Vietnam and found it to be centered around -0.53. In the Pesko et al.29 and Chelwa and van Walbeek25 studies cited earlier, they found that the own-price elasticity of tobacco products ranged from -0.40 to -0.90, and -0.26 to -0.41, respectively. In India, Guindon et al.26 carried out a study that aimed at estimating the impact of tobacco taxes on different socioeconomic groups. They found that smoking households in low socioeconomic strata respond more to price changes compared with households in other strata. Another study conducted by Selvaraj et al.23 on the price elasticity of tobacco products in India revealed that poorer consumers appear to be more responsive to price changes. They reported that the own price elasticity of bidi (a tobacco product popular in India) was the highest among poorer households at -0.43.
Limitations
This study has some limitations, which were mainly as a result of limited data. The price elasticity for the different types of tobacco products was not estimated since this was not elicited in the data. Also, the HNLSS involves household level data and as such important sociodemographics variables such as age, level of education and sex in the data set were strictly that of the household head. Consequently, this study may not have been able to capture the effect of these variables at individual level. Finally, as noted by Gibson and Kim30, it is not unlikely that the price elasticity of tobacco demand reported in this study overestimated the actual response of tobacco demand to price increase.
CONCLUSIONS
Our results showed that the price elasticity of tobacco demand was -0.63 and -0.49, for rural and urban samples, respectively, while the national value was -0.62. The implication is that for every 5% increase in the price of tobacco, there will be a corresponding reduction of about 3% in the quantity of tobacco demanded in the national and rural samples. While the same increase in the price of tobacco products will generate about 2% reduction in quantity of tobacco consumed in urban settings in Nigeria. In simple economic terminology, the demand for tobacco products in Nigeria is fairly price inelastic.