INTRODUCTION
Exposure to Secondhand smoke (SHS) occurs when non-smokers inhale tobacco smoke from burning cigarettes or from smokers’ exhaled smoke1. Subjects may be exposed to SHS in multiple sites, such as the home6, public places, cars, homes of relatives7, and the workplace8.
Exposure to SHS is a significant risk factor for a plethora of diseases and adverse health related outcomes at a global scale2 and is estimated to cause over 600,000 deaths annually, the majority of which are due to ischemic heart disease among adults3 Even limited exposure could ensue to development of diseases4,5 Therefore, accurate estimation of SHS exposure is important in both research and clinical practice.
Healthcare providers, and especially primary care providers (PHC), are in a unique role to raise awareness on the negative impact of tobacco use and SHS exposure9,10. Several constrains, such as shortages in workforce and inadequate training on counselling issues, may limit their time and eagerness to engage and counsel their patients on avoiding SHS exposure, turning primary health care field into a lost opportunity for tobacco use and SHS exposure prevention11,12.
Until now no inexpensive method for assessment of last week’s exposure to SHS have been developed13,14. Having the ability to properly validate a questionnaire in order to quantify exposure to SHS has not yet been achieved in a number of studies15, and is bound to aid patients’ monitoring and implementing targeted interventions. The development of a score that could be routinely used to indicate the extent of SHS exposure, and provide an estimate of the level of the exposure occurred is necessary. Up until now, the questionnaires are extensively used to assess SHS exposure but the importance of accurately quantifying exposure is essential in studies that wish to attribute causality, especially when employing biomonitoring may not be feasible due to financial, ethical or practical issues.
Hence, in the context of addressing the above research gap, we aimed to develop, an easy to implement, biomarker validated scale that can provide an estimation of individuals’ exposure to SHS for use within epidemiological research among adults.
METHODS
Study participants and nicotine assessment
Our study population comprised of 178 non-smoking adults, recruited from both urban and rural primary health care practices of variable socioeconomic baseline status, in Crete, Greece in November 2011. Inclusion criteria included non-smoking status, adult age, the ability to read and/or understand Greek and the mental capacity to provide informed consent. Prior to participants’ enrollment, written consent was obtained, while ethical approval was provided by the Institutional Review Board (IRB) of the University Hospital of Crete, Greece.
Sample collection and nicotine assessment
Following participants’ consent, a detailed pool of 26 baseline questions related to SHS exposure was administered. This pool of prospective questions was developed based on three factors: 1) The sources previously identified by our research group to be related to elevated levels of biomarker assessed exposure to SHS16,17,18 2) A detailed literature review of previous studies that had assessed SHS exposure and hair nicotine concentrations15,19,20,21,22 and 3) Domains included within the standardized global adult tobacco survey (GATS) and the global youth tobacco survey (GYTS)23,28. During participant recruitment, 10–100 mg of hair was concurrently collected from the occipital region of the scalp from each subject and stored in paper envelopes in a dry dark area until analysis. Details regarding the sampling methods applied and the measurement methods of assessing nicotine from hair samples are describedelsewhere16.
Statistical factor extraction of candidate questions
An exploratory factor analysis was performed to extract the latent variables (factors) underlying the correlation between the questionnaire items. We followed a standard approach to conduct a factor analysis.
First, we retained factors for the analysis based on four criteria: 1) Eigenvalues (i.e., the amount of variance accounted for by a factor) greater than 1, 2) Cumulative/total variance of 70%, 3) Inclusion of only items with factor loading 0.4 and 4) Graphical determination of the number of factors using the screen test. We plotted the eigenvalue associated with each factor and looked for a break between the factors with relatively large eigenvalues and those with lower explanatory power (small eigenvalues). Factors that appeared before the “elbow” were assumed to be meaningful and were retained for rotation. The principal factor method was used to analyze the correlation matrix. The factor loadings (factor patterns) were computed using the squared multiple correlations (smc) as estimates of the communality. We conducted an oblique (promax) rotation on the retained factors to enhance factor interpretation, under the hypothesis that the factors would be correlated with each other. Pattern loadings 0.4 were used to interpret the results. Subsequently, we identified which items loaded on what retained factors, as well as factors with multiple significant loadings and those that failed to load significantly on any factor. As we were interested in determining the most coherent and parsimonious combination of variables that would together, account for the highest variance in hair nicotine, within each factor we selected one predictor to adequately account for variance while simultaneously preventing collinearity. Candidate variables were selected based on their high factor loadings as well as their high internal consistency as determined by Cronbach’s α.
Statistical development of the SHS Exposure Scale (SHSES)
To generate scores for each question item, we fitted a backward linear regression using the main predictors of SHS exposure selected from the initial pool of questions. As the hair nicotine variable was highly right skewed (Skewness=5.91, median=0.8, range= 0.1-72.57), we performed a natural log transformation. Standardized coefficients were generated in order to allow a direct comparison of the predictors, to determine which had the greater effect on hair nicotine concentrations. We subsequently accorded scores to each exposure, proportional to the values of the standardized coefficients. Thus, the relative ranking of the standardized coefficients of the predictors was reflected in the score ranking to ensure that the relative impact or importance of each main predictor was preserved. Continuous variables are presented as mean (±standard deviation). All statistical analysis were performed with STATA 11.0.
RESULTS
Study population
Our study population was 178 non-smoking adults, approximately half (52%, n = 93) were from rural primary health care practices. Sixty eight percent of the sample were female while the mean age of the participants was 68.1 years (SD ±14.4), with a range spanning 21-91 years. The participants mean hair nicotine concentration was 3.08 ± 7.54 ng/mg, with a range of 0.1 to 72.57 ng/mg.
Factor Analysis and Selection of Predictors
The factor loadings and Cronbach’s α for the various question items are presented in Table 1. Based on those results, for Factor 1 we selected Q10:”how many times during the past week were you exposed to SHS at work?” (Factor loading 0.995, Cronbach’s α 0.831); Factor 2- Q16 “On average how many minutes per day do you spend inside a car with someone smoking?” (Factor loading 0.841, Cronbach’s α 0.838); Factor 3- Q5:”How many cigarettes are smoked per day in your house on average?” (Factor loading 0.940, Cronbach’s α 0.839), and Factor 4- Q13:”How many times last week did you go out to public places” (Factor loading 0.976, Cronbach’s α 0.842). When compared to the initial pool of questions and controlling for sociodemographic characteristics of the population, these four factors had over 95% of the explanatory power of the 26 item model and consistently had more favorable AIC values at all cut-offs for hair nicotine (Table 2), thus excluding the need to include sociodemographic or other factors in the final analysis. An overview of the process is depicted in the flowchart (Figure 1).
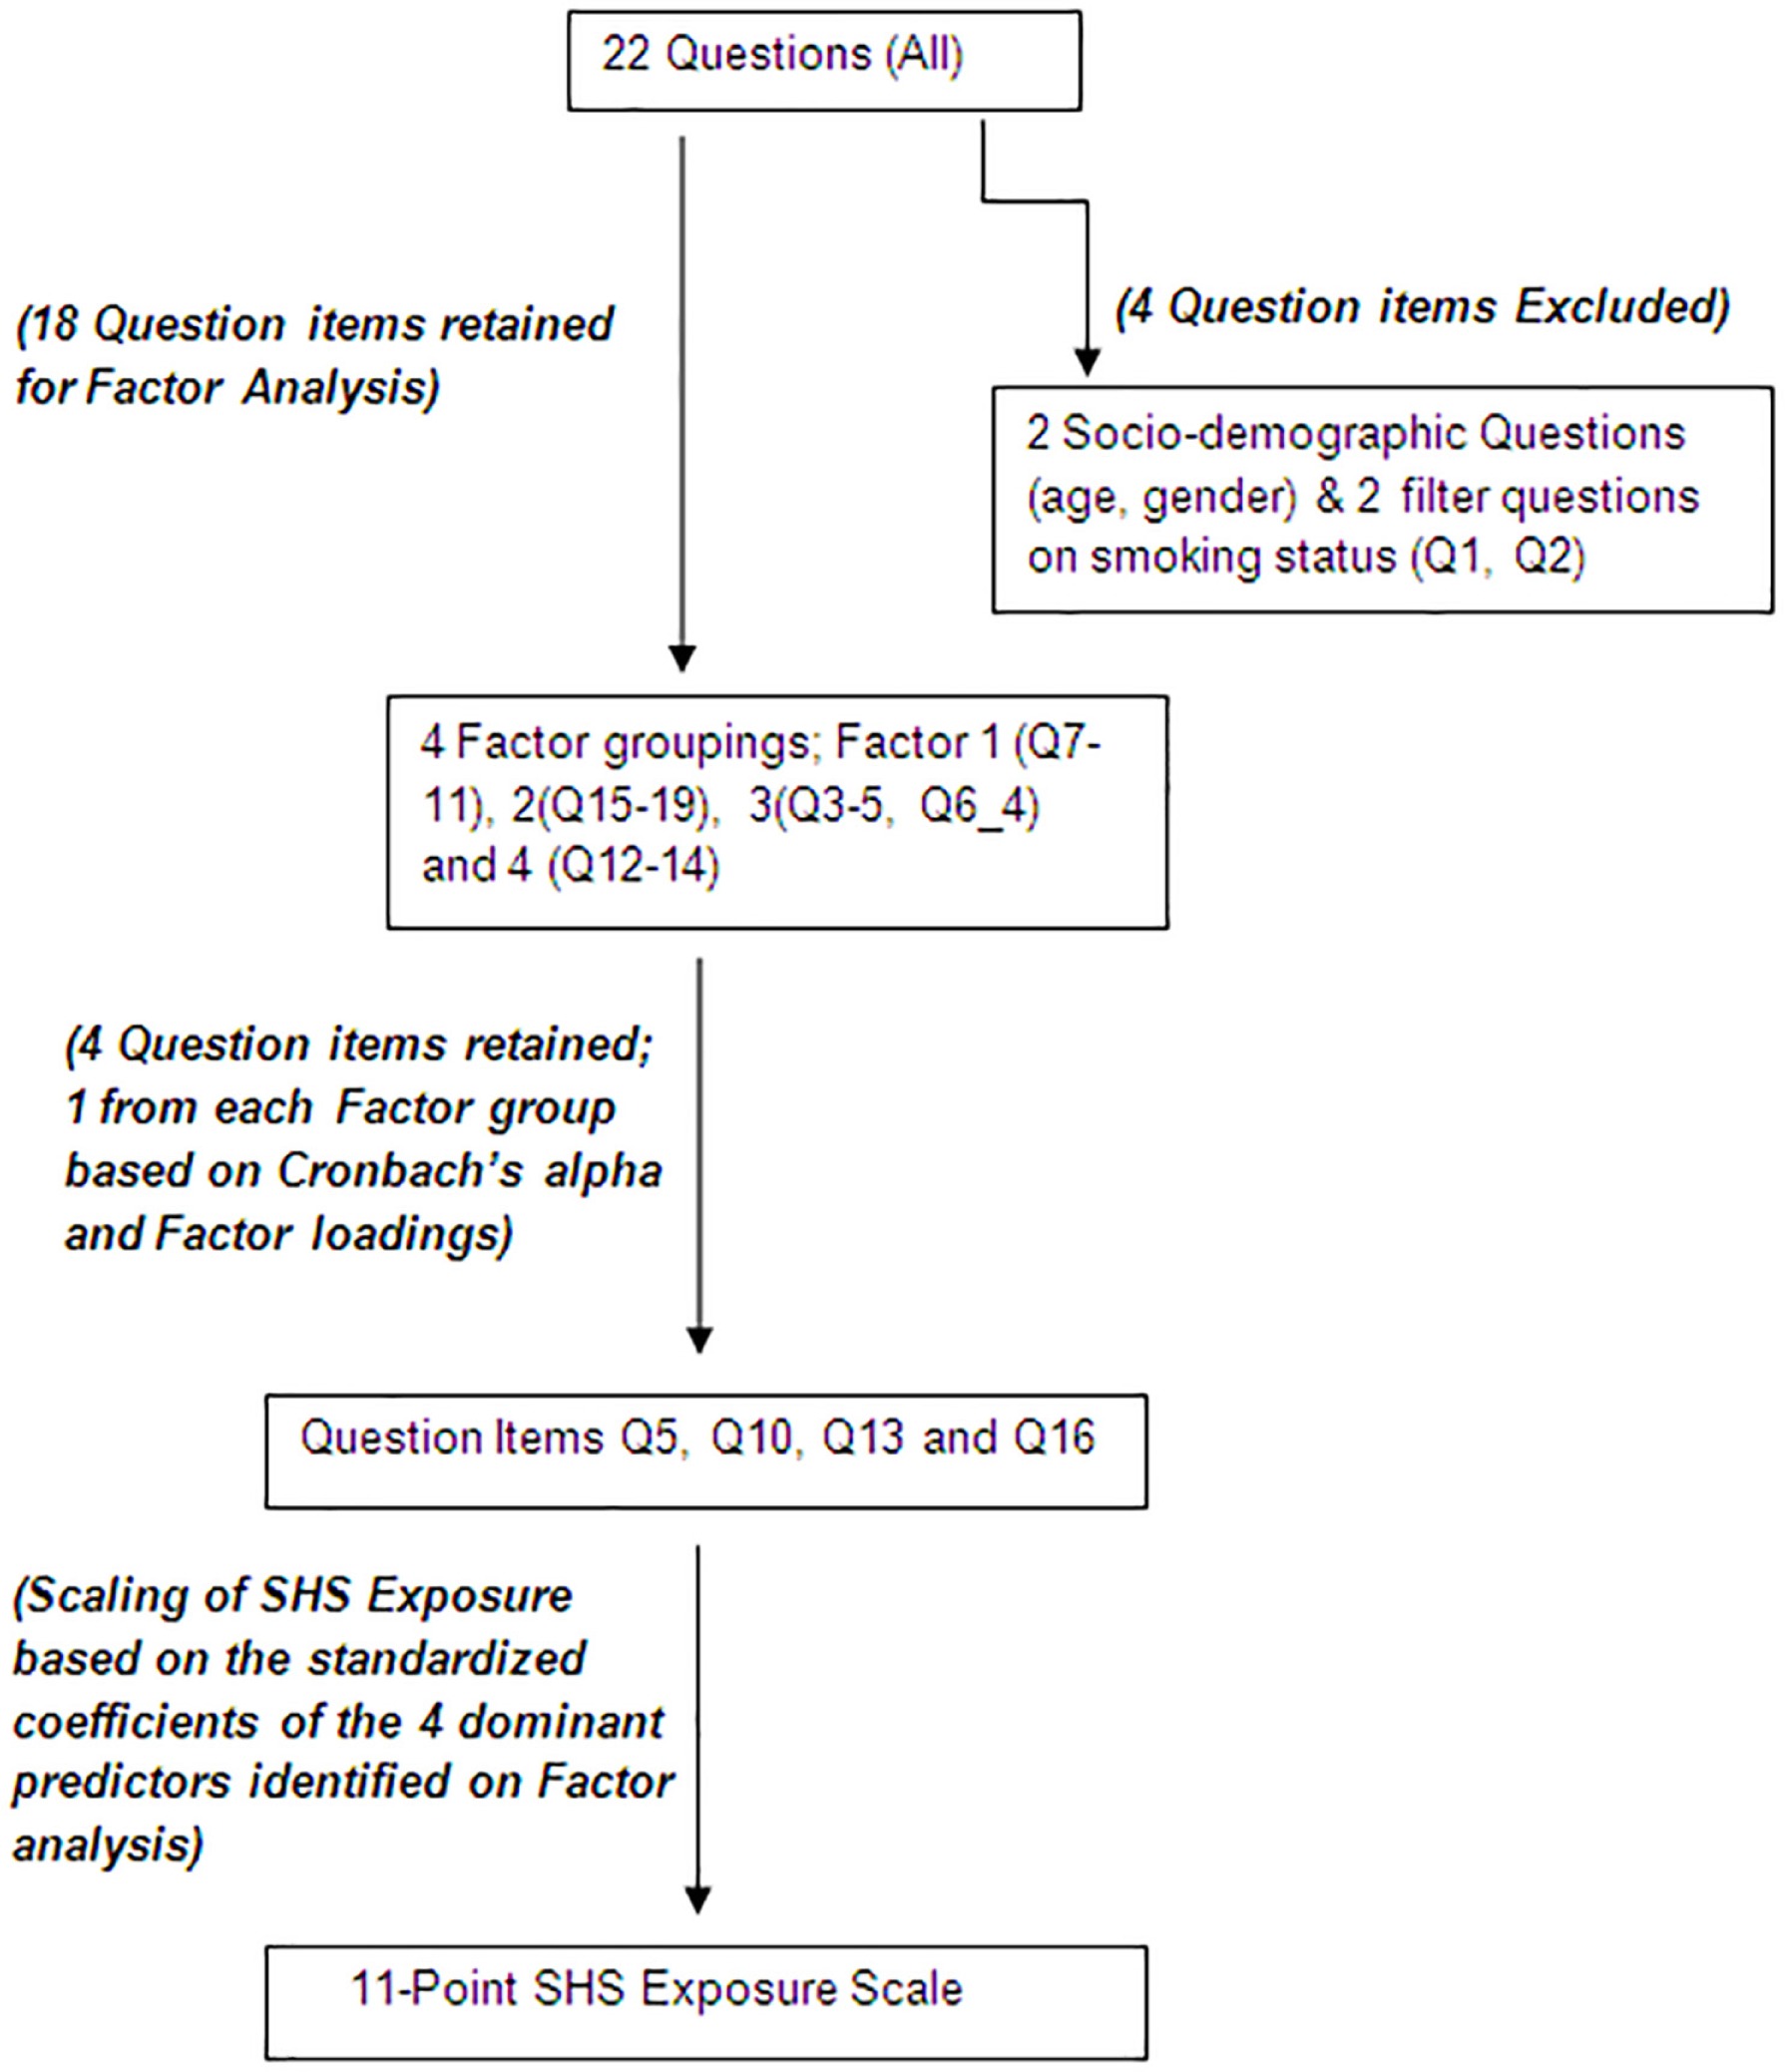
Table 1
Rotated (oblique) factor analysis with standardized regression coefficients and Conbrach’s a for predictors of hair nicotine concentrations in relation to self-reported exposure to SHS ‡
| Factor | % variance (cumulative) | Eigenvalue | Factor I | Factor II | Factor III | Factor IV | Cronbach’sa |
|---|---|---|---|---|---|---|---|
| Factor I. Exposure to SHS in the workplace | 33.21 (33.21) | 6.77 | |||||
| Q10: Ηow many times during the past week were you exposed to SHS at work?† | 0.995 | 0.831 | |||||
| Q7: Do you work? | −0.994 | 0.831 | |||||
| Q8: Were you exposed to SHS at work during the last month? | 0.994 | 0.831 | |||||
| Q9: What was the frequency of SHS exposure at work last month? | 0.995 | 0.831 | |||||
| Q11: Are you ever exposed to SHS at work? | 0.994 | 0.831 | |||||
| Factor 2. Exposure to SHS in a Vehicle | 15.36 (48.57) | 3.13 | |||||
| q16: On average how many minutes per day do you spend inside a car with someone smoking?† | 0.841 | 0.838 | |||||
| q15: On average how many minutes last month do you spend inside a car with someone smoking? | 0.857 | 0.836 | |||||
| q17: On average how many minutes per week do you spend inside a car with someone smoking? | 0.820 | 0.838 | |||||
| q18: Have you been exposed to SHS in public places during the past month? | 0.606 | 0.848 | |||||
| q19: How often per week do you visit public places where people smoke? | 0.670 | 0.846 | |||||
| Factor 3. Exposure to SHS at Home | 15.36 (61.91) | 2.72 | |||||
| q3: Are you exposed to SHS at home?† | 0.940 | 0.839 | |||||
| q4: How often are you exposed to SHS at home? | 0.908 | 0.836 | |||||
| q5: How many cigarettes are smoked per day in your house? | 0.644 | 0.838 | |||||
| q6: How often to other people smoke in your house per week? | −0.683 | 0.852 | |||||
| Factor 4. Exposure to SHS from other areas | 10.25 (72.15) | 2.09 | |||||
| Q13: How many times last week did you go out to public places?† | 0.976 | 0.842 | |||||
| Q14: How many times last month were you exposed to SHS in public places? | 0.880 | 0.842 | |||||
| Q12: Were you exposed to SHS the last time you were in public places? | 0.958 | 0.842 |
† Standardized regression coefficients have been multiplied by 100 and rounded. Factor 1 consists of items 12-16 (Q7-11), Factor 2 consists of items 20-24 (Q15-19), Factor 3 consists of items 3-5, item 10 (Q3-5, Q6_4), Factor 4 consists of items 17-19 (Q12-14). items 6, 7, 8, 9 (Q6_0, Q6_1, Q6_2, Q6_3 and Q6_5) had very high uniqueness valuess (0.6032, 0.9571, 0.9699, 0.9412 and 0.9663 respectively) and failed to load significantly on any retained factor. Item 25 (Q20) also did not load on any factor.
Table 2
Comparative analysis between the 4- and 26-item models (including sociodemographic questions) in predicting hair nicotine concentrations†
SHS exposure scale (SHSES)
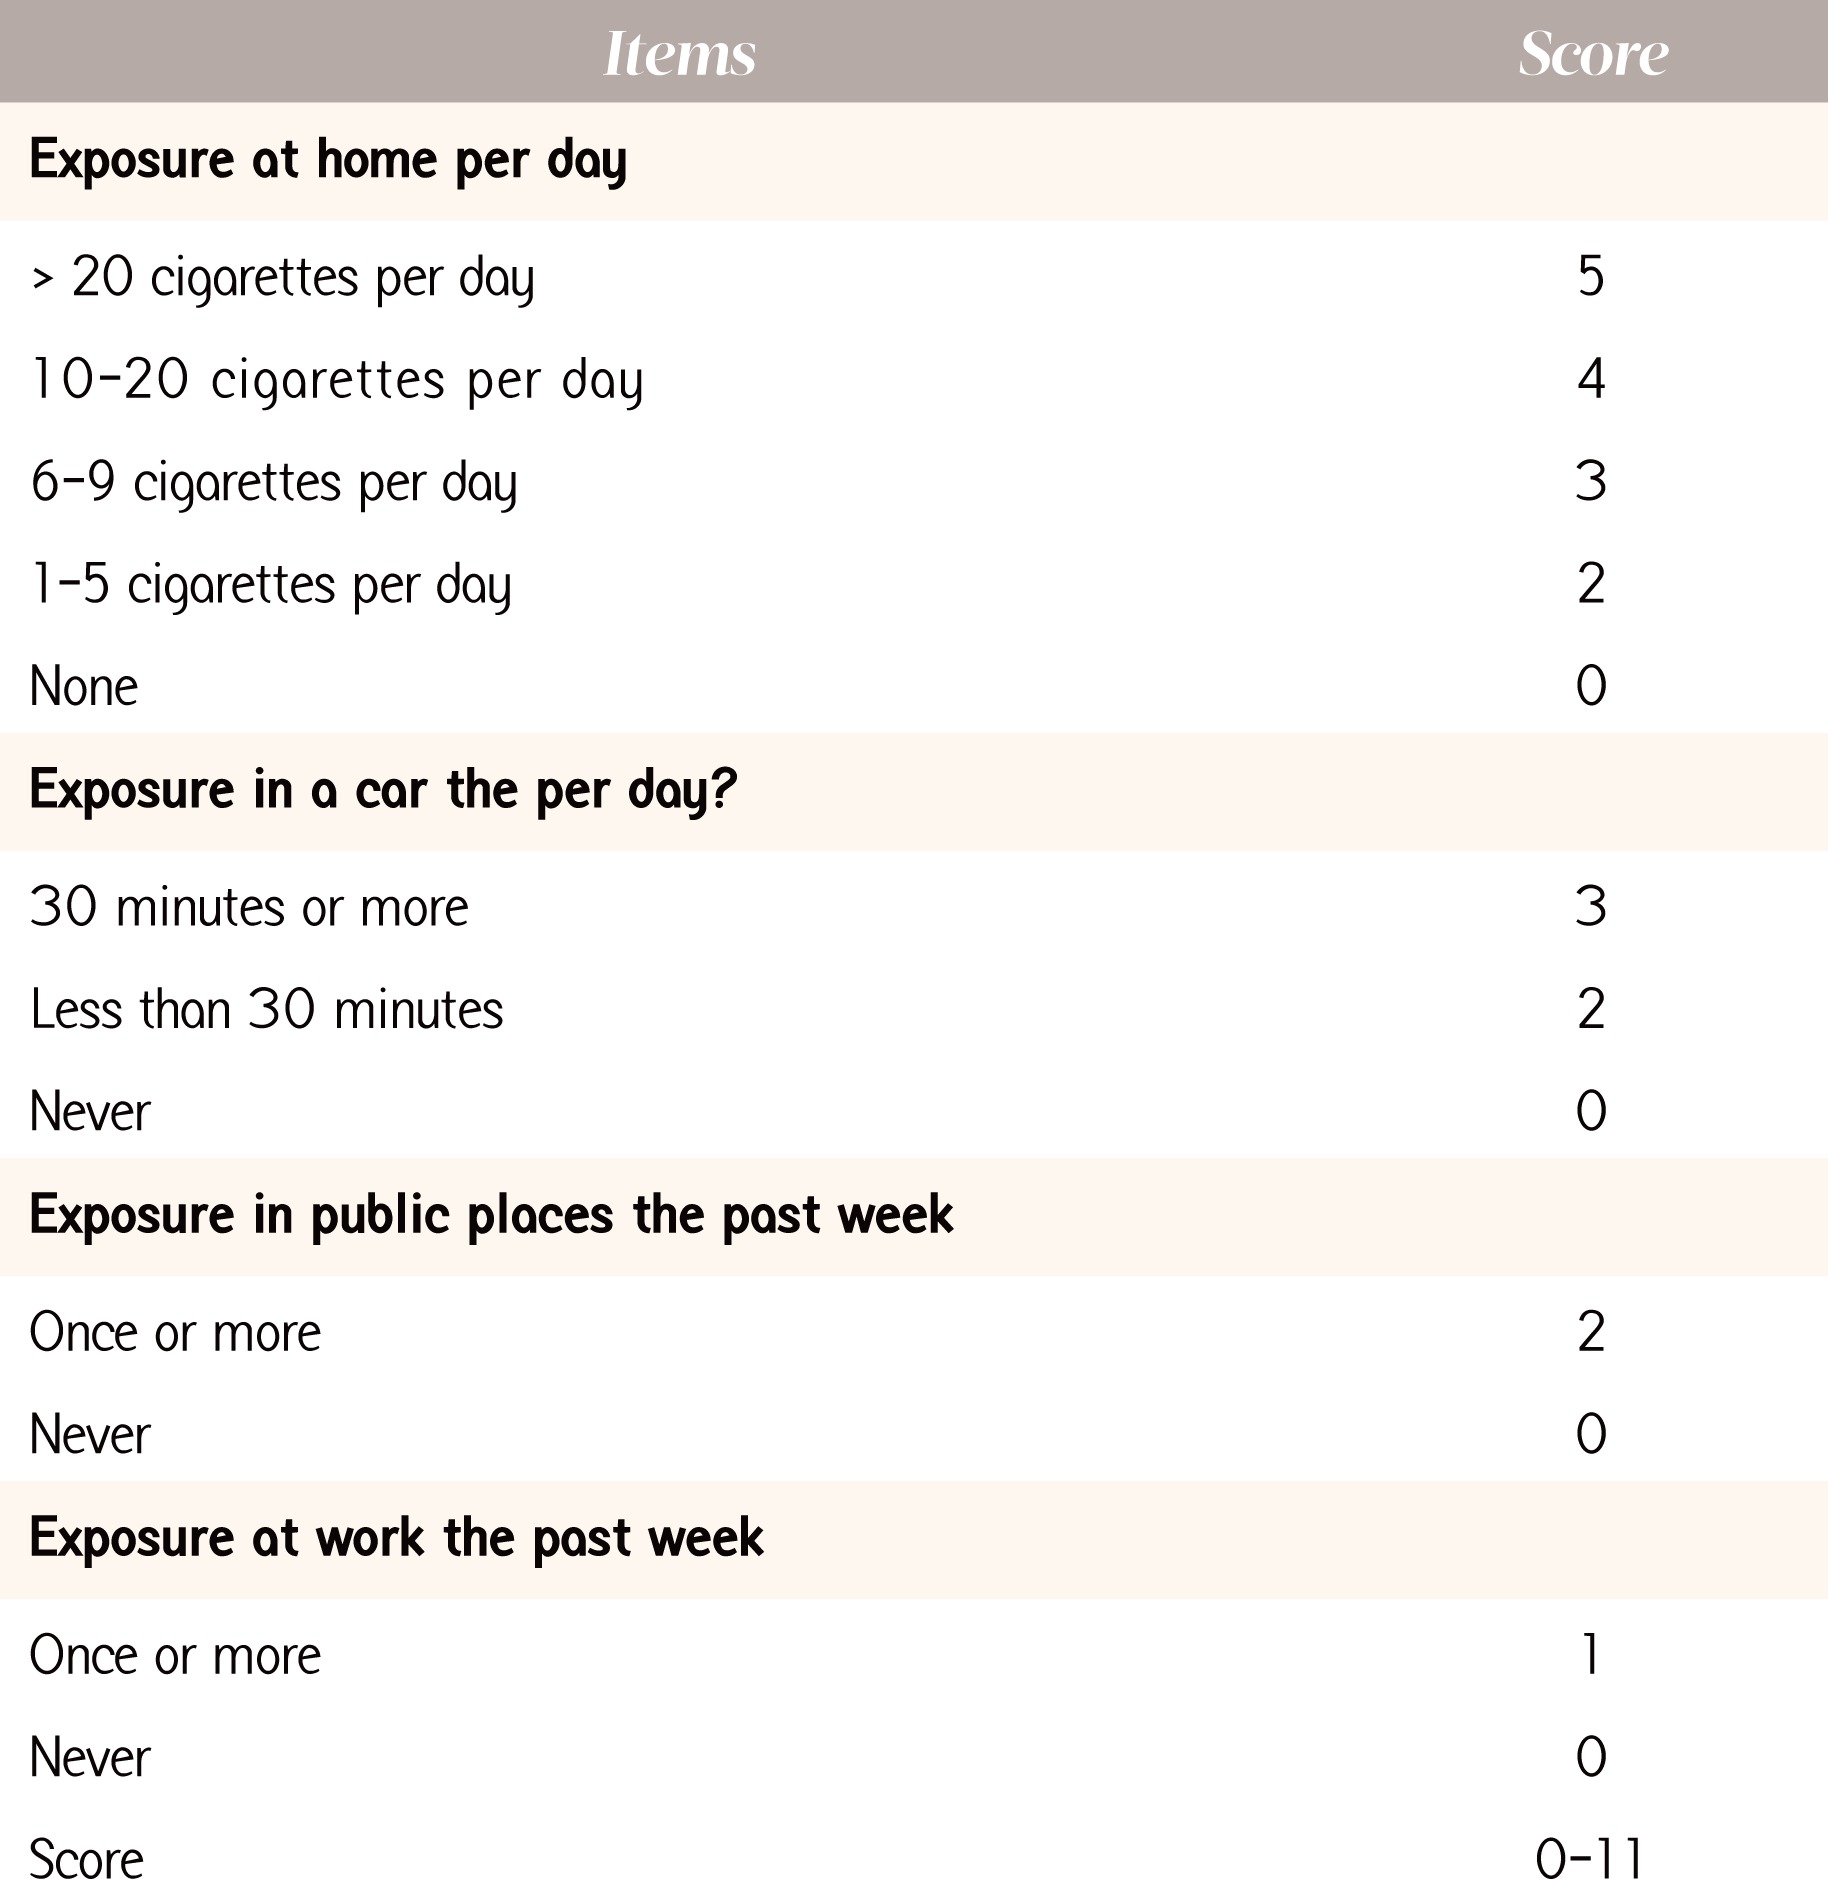
The standardized coefficients and scores assigned to each category of the 4-predictor items are depicted in Table 2. In descending order, the most important sources of SHS exposure were the home (Standardized β=0.37), the family car (Standardized β=0.20), public places (Standardized β=0.15) and the workplace (Standardized β=0.013). Using the proportional values of the standardized coefficients, we attributed scores to each exposure so as to ensure that the relative impact of each predictor was preserved. The highest score was for exposure at home with a maximum of 5 points (corresponding to exposure to >20 cigarettes per day), 4 points (exposure to 10-20 cigarettes/day), 3 points (exposure to 6-9 cigarettes/day), 2 points (exposure to 1-5 cigarettes/day) and 0 points respectively, for subjects with no household exposure to SHS. SHS exposure in a vehicle attributed a maximum of 3 points, for those exposed for 30 minutes per day, 2 points for those exposed < 30 minutes per day and 0 points for no such exposure. Exposures to SHS in public places and at work were dichotomized (once or more vs. never); with a maximum score of 2 points for exposure in public places once or more during the last week and 1 points for exposure to SHS in public places and work respectively. Thus, the maximum score of the SHSES was 11 points, while the minimum score was zero. The final SHSES is depicted in Figure 2. The correlation between the SHSES and the participants biomarker validated exposure (hair nicotine), indicated a Pearson’s correlation of 0.4939, with a p-value <0.0001. Moreover, for every unit increase in the SHSES, there was an associated increase in mean hair nicotine concentrations by 1.35 ng/mg (95%CI: 1.25-1.45, p<0.0001), indicating that an increase in the SHSES score could be implemented to categorically quantify levels of exposure within a population group (i.e. low vs. medium vs. high exposure).
DISCUSSION
The SHSES is a biomarker validated 11-point scale, which comprises four ranked questions, weighted to each response’s relative contribution to overall nicotine levels among adults. Our analysis indicated that each point increase in the score is associated with an increase in hair nicotine levels, an indicator of exposure to SHS.
The assignment of points to each answer facilitates the classification of the total exposure on SHS. Similar questionnaires developed in the past were only able to provide categorical classification16, not taking into consideration the different levels of SHS exposure, for example, by assessing the relative magnitude of exposure to SHS from each source. The model proposed in this study combines questions about exposure to SHS at home, at work, from public places and in the car. Car exposure is a novel factor for adults, compared to previous efforts17 and it enhances the explanatory power of the model. SHS exposure in the car has previously been shown to be associated with hair cotinine level in children, but not among adults yet18. According to the SHS exposure scale, exposure at home was the most important source of SHS exposure, a finding consistent with studies in various settings16,22
Hair nicotine is considered to be an effective way of assessing SHS due to the fact that it is not an invasive method and indicates clearly the intervalidity16. Apart from some cases, such as chemical treatments25, external factors do not affect hair. This renders hair nicotine as a safe measure towards assessing SHS and conducting a study with accuracy on adults. While collecting hair sample is time efficient, it could also add more validity to the study, since substances are found in higher levels and more easily than in tissues26,27 Questionnaires may lack precision to quantify low levels of SHS exposure and are subject to recall and reporting bias3, which may result to some degree of misclassification15. Furthermore, they are reported to be a “complementary” method rather than alternative ones, due to the fact that they can only be used to diminish another method’s limitations24. On the other hand, some biomarkers may have emerged as easy and inexpensive methods for long-term measurement of exposure6, but are still subject to certain limitations, including lower participation rates, insufficient sensitivity to detect very low exposures, and not taking into account behavior changes by smokers influenced by active monitoring9
The main strength of this scale is that it constitutes a biomarker-validated approach, which may potentially allow the use of SHSES for studying exposure-disease associations. However this study is not without limitations. One of the limitations of this study is the small sample size available for the analysis. No generalization is intended to be made, however this could be a promising start for further research. Moreover, the levels of exposure to SHS in public places have been found to be high in Greece29. Considering that hair nicotine levels are associated with the level of exposure to SHS, it is likely that the proposed model might slightly underestimate exposure to SHS from public places, as the age group also included elderly adults and participants from rural areas who may not have the same exposure characteristics as younger adults in urban areas. Additionally, only a small fraction of the population from which the model was derived was of working age, therefore exposure to secondhand smoke in the workplace might also have been underestimated. For these reasons, it would be useful to test the model in younger populations.
CONCLUSIONS
It is recognized that biomarker assessment of SHS may provide an advantage over questionnaire assessment with respect to their accuracy, however the practical usefulness of a biomarker validated 11-point scale for assessing SHS is evident. The SHS exposure score (SHSES) scale may be a useful tool in assessing the exposure to SHS and investigating the relationship between SHS exposure and potential health outcomes especially among elder populations where biomarker assessment of SHS exposure might be expensive or not feasible to measure.