INTRODUCTION
Ireland has very progressive tobacco control policies. The price of a packet of 20 cigarettes was €12 in 2017. Smoking in workplaces was banned in 2004, making Ireland the first country in the world to institute an outright ban on smoking in workplaces. Ireland was the first European Union (EU) country to implement the point-of-sale display ban in 2009 and in 2017 Ireland become the fourth country in the world to introduce plain packaging for tobacco product, including cigarettes and roll-your-own tobacco.
In 2013, the government launched Tobacco Free Ireland, which is a government policy forming part of an overall strategy of creating a ‘Healthy Ireland’ and it sets a target for Ireland to be tobacco free by 2025. It is agreed that in practice, this will mean a smoking prevalence rate of less than 5%. The action plan addresses a range of tobacco control issues and initiatives, and contains over 60 recommendations within the Framework Convention on Tobacco Control (FCTC). Some of the recommendations have already been implemented. For example, since July 2014, Nicotine Replacement Therapy (NRT) has been authorised for sale in general retail and grocery outlets without a prescription, which has been taken into account in the model. Some recommendations, by their very nature, are on-going, such as continuing collaboration with national and international partners on strategies to reduce illicit trade in tobacco products1.
The purpose of this paper is to update and further validate the previous SimSmoke Ireland model2 and evaluate if the Tobacco Free Ireland target is feasible using the same model to allow comparison with the situation in 2010. It examines the effects of tobacco control policies implemented between 1998 and 2016 on reductions in smoking prevalence and smoking-attributable deaths (SADs); it assesses the potential of further policies fully consistent with World Health Organization (WHO) recommendations.
METHODS
SimSmoke is a dynamic computer simulation model that projects trends in smoking prevalence, estimates the number of smoking attributable deaths, and assesses the effects of tobacco control policies on the outcomes3. To establish pre-policy trends, the tracking period starts from starts from 1998, the same as the previous model, as 1998 was the first wave of the Survey on Lifestyle and Attitude to Nutrition (SLÁN), which provided smoking prevalence data and was also the year before major policy intervention. The end of the tracking period is extended to 2016, from 2010 in the previous model, to include policies implemented in the period 2010 to 2016 that included higher cigarette taxes leading to 26% higher real prices (see Appendix), stronger graphic health warnings, improved youth access enforcement and allowing NRT to be sold without prescription. We then evaluate the effect of policies from 1998–2016 and project the effect of stronger policies from 2017 through to target year 2025. SimSmoke consists of three central components to create the expected projections, a population module, smoking module and policy module.
Population module
This module allows population size to evolve over time based on base year population, fertility rates and mortality rates. The data source is the same as the previous model. Population data (1998), mortality rate (2002) and fertility rate (2004) were obtained from the Central Statistics Office (http://www.cso.ie).
Smoking module
In this module, the population in the base year is divided into smokers, ex-smokers and never smokers. Each year, individuals may evolve from smokers to ex-smokers through cessation and may return to being smokers through relapse. Never-smokers may become smokers through initiation. All individuals are classified as never smokers from birth until they initiate smoking or die.
The initial smoking prevalence data were from the 1998 SLÁN survey, which was based on a self-administered questionnaire sent to a nationally representative sample of the Irish population aged 18 years and older. If the answer to ‘Do you smoke cigarettes now’ is ‘yes, regularly’ or ‘yes, occasionally’, the individual is defined as a current smoker. Former smokers were defined as those who did not currently smoke but had smoked regularly in the past.
The following waves of SLÁN surveys (2002, 2007) and other national surveys Healthy Ireland (HI) 2015 and Smoking Prevalence Tracker (SPT) 2002–2016 are used for model validation. SLÁN 2002 used the same questions in the questionnaires and the same definitions of smokers are used as in the 1998 survey. SLÁN 2007 and HI 2015 used interviewer administered face-to-face surveys. Smokers in the 2007 survey are defined in the same way as in the 1998 and 2002 surveys, but distinguished by the 100 cigarettes cut-off. Smokers in HI 2015 are defined in the same way as in the 1998 and 2002 surveys. SPT survey 2002–2016 was a nationally representative telephone omnibus survey on 1000 respondents per month from July 2002 to March 2016 and quarterly since then. Smoking is defined by the response ‘yes’ to the question ‘Do you smoke one or more cigarettes each week’.
Based on the SLÁN 2007 survey, the first survey that has the data on the duration of quitting, cessation rates are calculated as the number of former smokers who quit in the last year divided by the number of those smoking one year ago (current smokers plus those who quit in the last year). As there are no available data to measure relapse rates in Ireland, US rates are used5,6.
Total SADs were obtained from summing up the number of current and former smokers at each age multiplied by their relative risk attributable to smoking. However, relative risk data are unavailable in Ireland. Given the similarities between Ireland’s smoking history and that of the USA, we use relative risk data from the US Cancer Prevention Study II, which is about 2.4 for men and 2.1 for women7,8. It is also assumed that relative risks decline with years of abstinence, at the rate observed in US studies9.
Policy module
The model takes into account seven categories of tobacco control policies as shown in Figure 1. The input data on policy levels for each year from 1998 to 2016 are based on information from the MPOWER report11 and from the Department of Health with corroboration from Irish tobacco control researchers. MPOWER is a policy package intended to assist in the country-level implementation of effective interventions to reduce the demand for tobacco, as ratified by WHO FCTC. Policy effect sizes are in terms of percentage reductions relative to the initial smoking prevalence and are applied to the smoking prevalence rate in the year the policy is implemented and to initiation and/or cessation rates in the future years if the policy is maintained. For example, the effect of a comprehensive marketing ban would have an effect of 5% reduction in prevalence, 6% reduction in initiation and 3% increase in cessation rates. The effect parameters are determined by thorough literature reviews and expert panel advice10. Policy descriptions with their effect sizes are the same as Table 1 from the previous paper2.
Analyses
Based on the data entered for the three modules, the SimSmoke Ireland model will project the smoking prevalence and SADs from 1998 to 2016 considering all the policies implemented between 1998 and 2016, and predict future outcomes from 2017 to 2025.
The prevalence projection between 1998 and 2016 will be compared with SLÁN 2002, SLÁN 2007, HI 2015 and SPT 2002-2016.
The overall net impact of all the policies implemented between 1998 and 2016 could be estimated by first setting policies through 2016 to their 1998 levels and then getting the difference between smoking prevalence with policies at their 1998 level and the prevalence with all policies in place.
The net contribution of single policies could be estimated by comparing the scenario with only that policy implemented to the scenario with all policies at their 1998 level.
The prevalence prediction by the model for year 2025 was compared to 5%, which is the target prevalence under Tobacco Free Ireland. If it is smaller than 5%, it means that maintaining the policies at 2016 level would be sufficient to achieve the goal. Otherwise, policies need to be strengthened from 2017. If the policies from 2017 are improved so that all policies are fully compliant with the MPOWER recommendations, the prediction of prevalence of 2025 will again be compared to the 5% target to see if fully complying with MPOWER recommendation will help Ireland realize Tobacco Free Ireland on time.
RESULTS
Predictions of smoking prevalence and roles of policies from 1998 to 2016
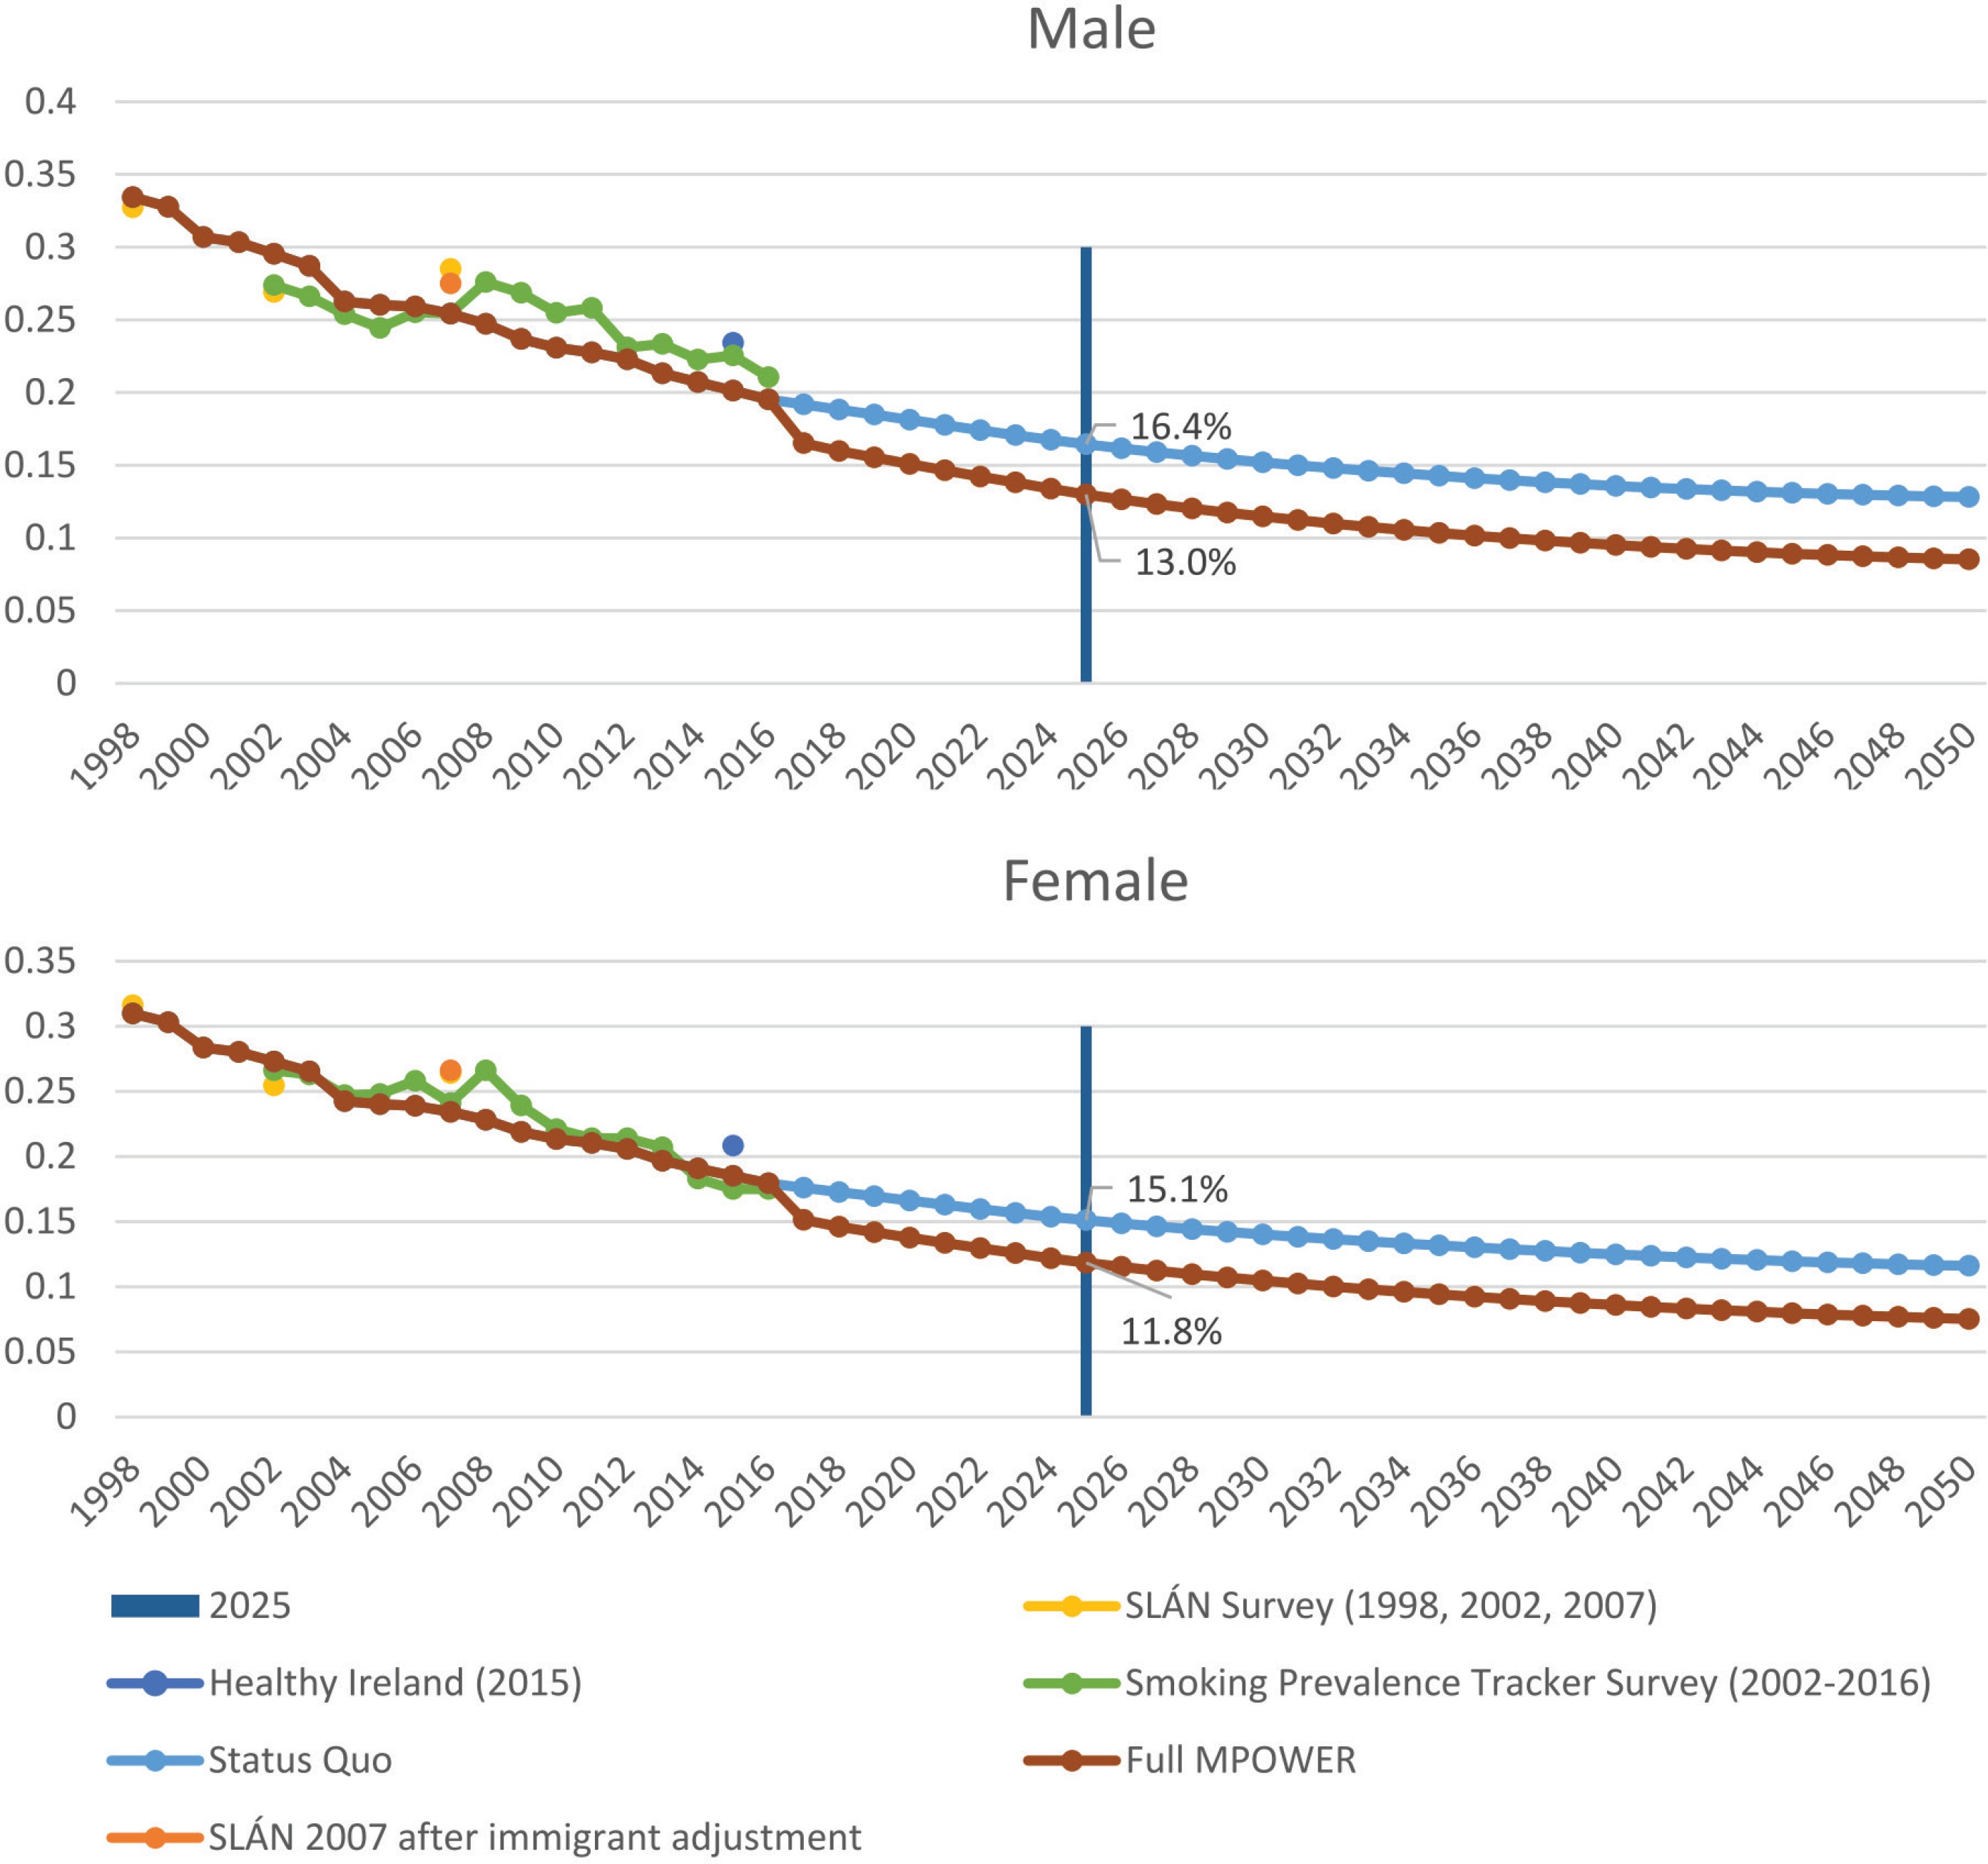
SimSmoke predicts that male prevalence of those aged 18 years and older decreased from 33.4% in 1998 to 19.5% in 2016, which is a 41.6% relative decline. Female prevalence from 1998 to 2016 was predicted to drop from 31.0% to 17.9%, a 42.3% relative decline (Fig. 1).
If policies were held at 1998 level throughout the 1998–2016 period, the prevalence by 2016 would be 31.3% for males and 29.1% for females. Due to policies implemented between 1998 and 2016, it achieved a reduction of 37.7% for males and 38.5% for females, relative to the levels that they would have been if policies were held at the1998 level. In terms of SADs, a total of 969 fewer SADs are estimated by 2016 as a result of the policies implemented between 1998 and 2016.
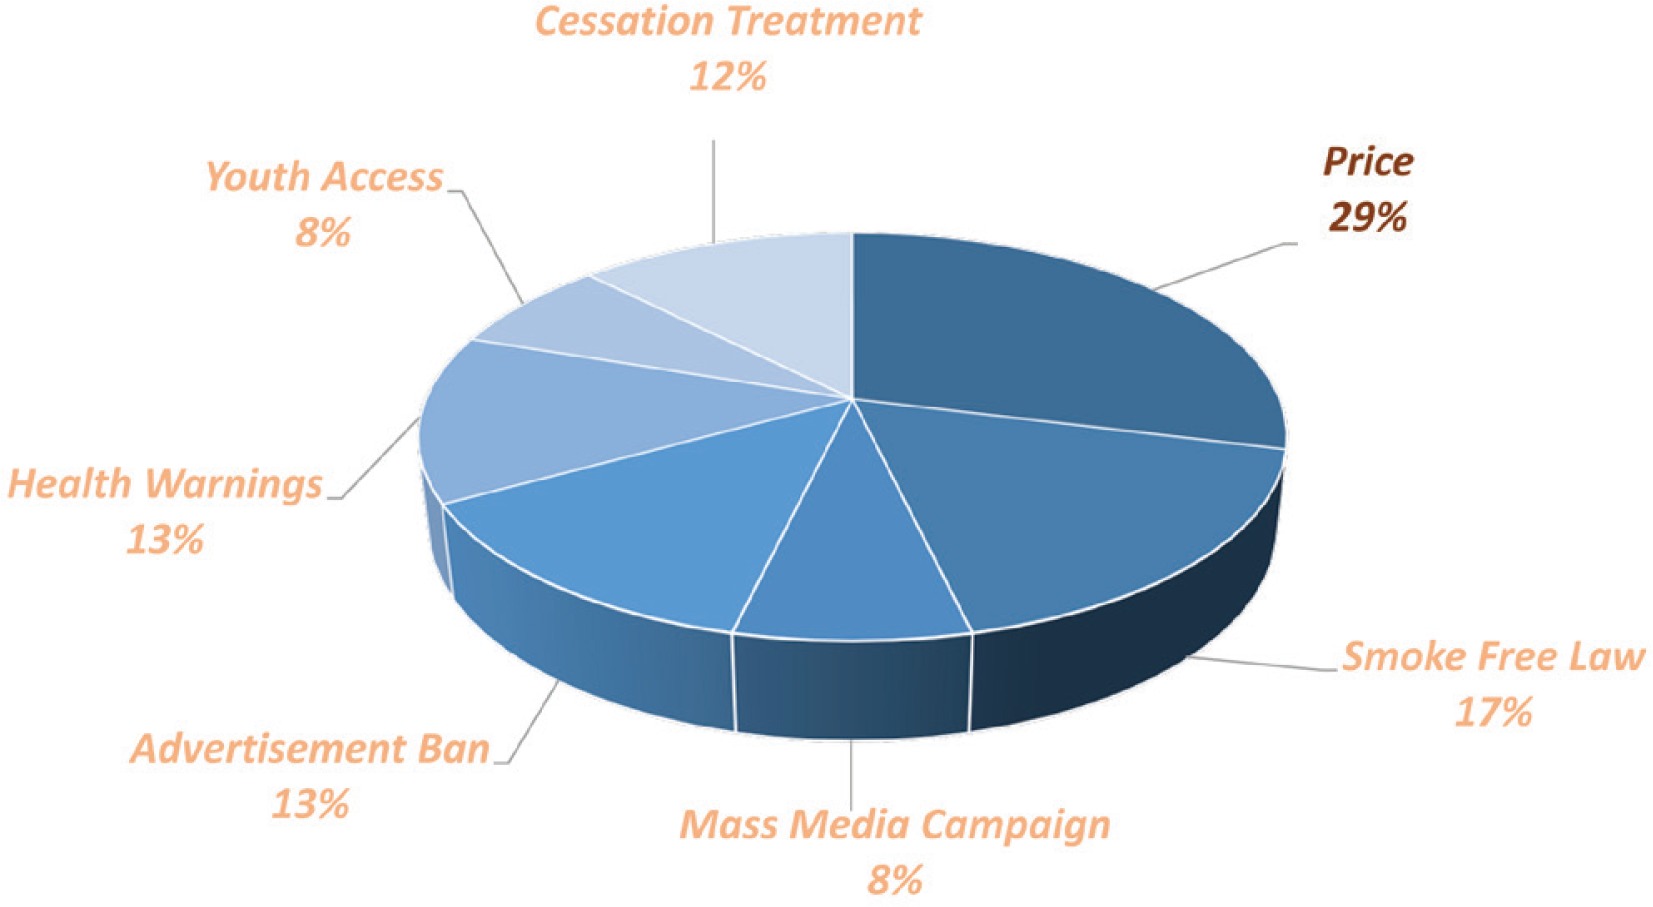
Examining the role of individual policies in the 37.7% relative reduction in male prevalence due to all policies, 29% is attributed to price/tax policies, and 17% to 2004 Smoke-Free law. Cessation treatment policies, health warnings and advertisement bans each contributes about 12–13%. Youth access enforcement and mass media campaign each contributes about 8% (Fig. 2). The contribution of policies to the reduction in female smoking prevalence is very similar to that for male prevalence.
Is Tobacco Free 2025 feasible?
Status Quo scenario-policies held constant at 2016 level
If policies are held constant at the 2016 level, male smoking prevalence will be projected to drop from 19.5% in 2016 to 16.4% in 2025, and that of females from 17.9% to 15.1%. Although it is a relative decline of 16% for both males and females compared to the 2016 level, the prevalence in 2025 is still far from the target 5%.
Stronger policy scenario-policies fully compliant with MPOWER recommendations
If the policies from 2017 are improved so that all policies are fully compliant with the MPOWER recommendations, male and female prevalence in 2025 will be 13.0% and 11.8%, respectively. From Figure 2, we can see the divergence of the projections between the Status Quo scenario and stronger policy scenario. The combined effect of polices fully compliant with MPOWER in terms of percentage change in smoking prevalence from Status Quo is 20.7% for males and 21.9% for females.
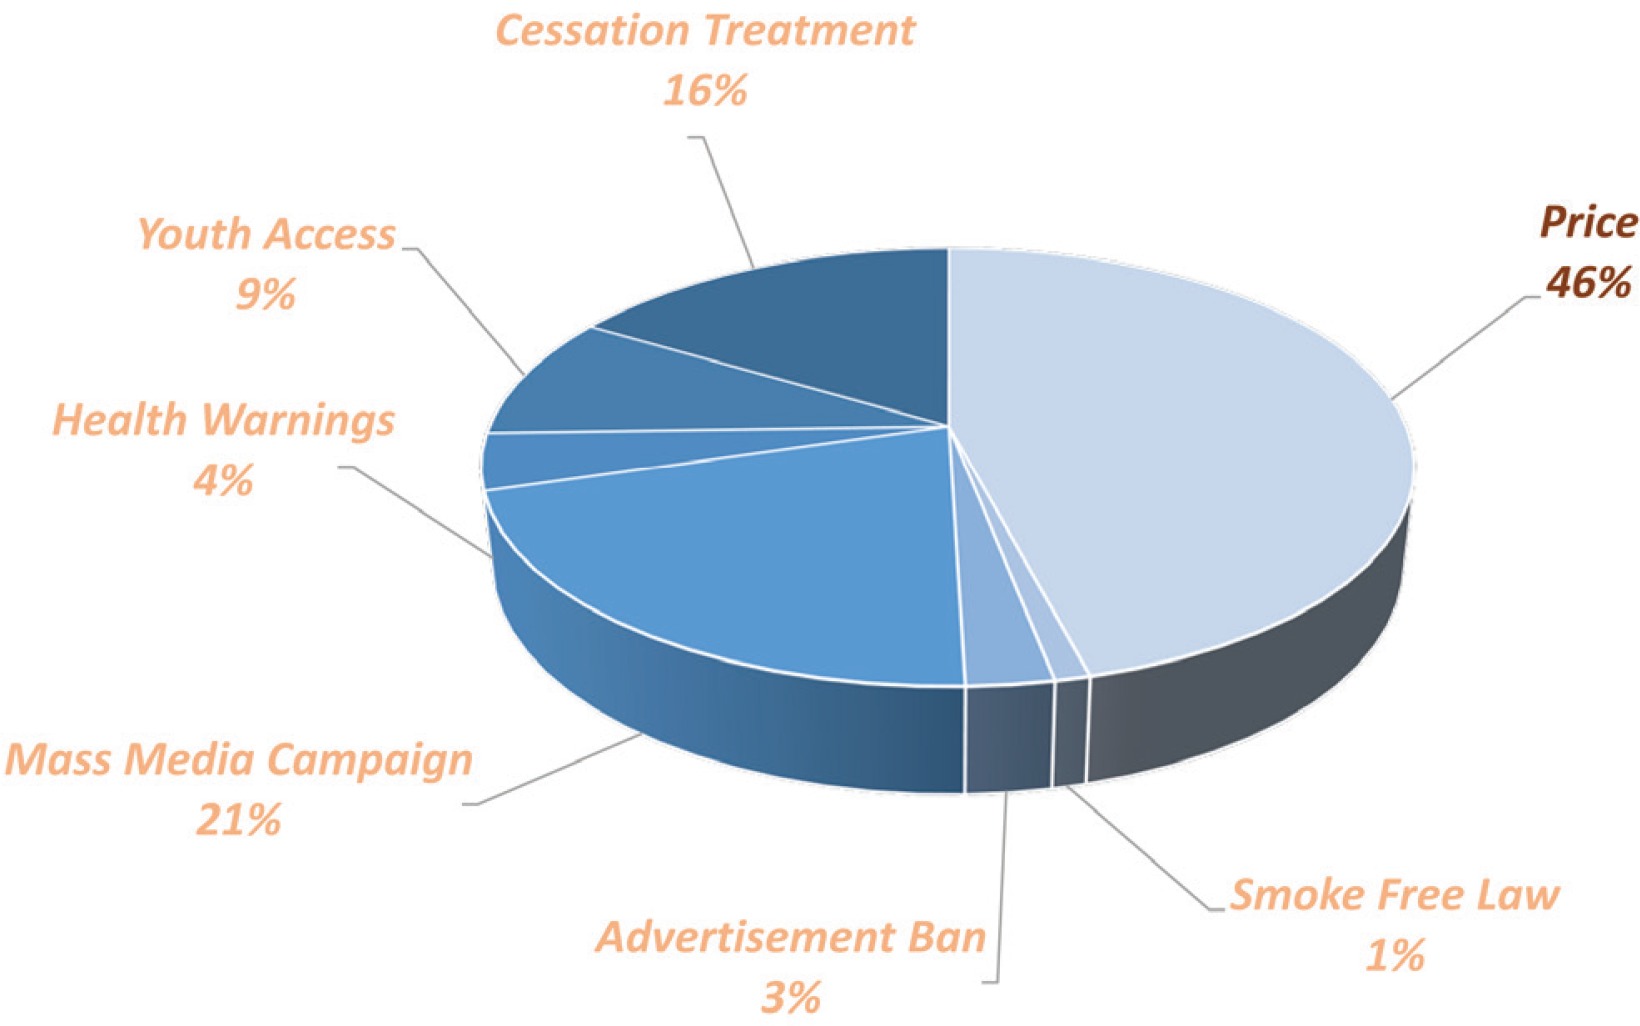
In terms of individual policy contribution for the reduction of male prevalence, increasing price remains the most effective way of reducing prevalence, which contributes to 46% of the reduction. The second most effective policy is high intensity tobacco control media campaigns, which contributes to 21% relative reduction. Further, 16% is attributed to cessation treatment and 9% to youth access enforcement. Health warnings and advertisement bans each contributes 4% and 3%, respectively, while smoke free law contributes 1% (Fig. 3). The contribution of policies to the reduction in female smoking prevalence is very similar to that for male prevalence.
DISCUSSION
The predictions between 1998 and 2016 are validated against various surveys. Predicted male prevalence underestimates the prevalence drop from 1998 to 2006, being slightly higher than SLÁN 2002 and Smoker Prevalence Track (SPT) series4,12,13. In 2007, the prediction coincides with SPT data, but is smaller than SLÁN 2007, although likely reflecting the different definition of smokers and sampling frames in the SLÁN 2007 compared to the SLÁN 200214. In particular, SLÁN 2007 asked if individuals had smoked 100 or more cigarettes in their lifetime and also defined smoking as ‘every day’ or ‘some day’. In addition, more immigrants were included due to broadened sample coverage. After 7.1% of immigrants from other than the UK are removed, the updated sample has male prevalence of 27.5%, making male prevalence closer to the model prediction. After 2007, the predictions slightly overestimate the prevalence drop, as the predictions are smaller than the prevalence from SPT and HI 201515. The increased prevalence in SPT around 2008 was due to a methodological change to the survey in May 2008, expanding coverage beyond landline telephone to a combination of both landline and mobile phone numbers. However, STP still shows a declining trend in prevalence after 2008. At 2016, the model prevalence prediction was very close to the SPT prevalence.
Prediction of female prevalence is even closer than that of male prevalence in terms of matching SPT data. Except for the same hike observed in males’ prevalence around 2008, the female prevalence from SPT matches the model prediction quite well. Before 2014 the SPT data were slightly above the prediction trend and slightly below the trend in the last three years. In terms of SLÁN and HI 2015, the relative positions of the model prediction to the survey data are similar between males and females. The SLÁN 2007 female prevalence is almost the same after immigration adjustment.
In summary, the model predicts prevalence reasonably well between 1998 and 2016, for both sexes, by mirroring the large decline of prevalence from various surveys. However, the validation power of the surveys depends on the methodology used and the years considered, as suggested by the variation in results between the SLÁN and SPT data.
It is a challenge to measure and compare the effectiveness of individual tobacco control policies per se, as they are seldom implemented alone, are measured in different units, and incur different costs. This study considers how they have contributed to the reduction of smoking prevalence based on previous studies of policy effectiveness and their current level of implementation. For example, media campaigns constitute one of the least efficient tobacco control policies between 1998 and 2016 according to Figure 1, partly due to its low level of implementation in Ireland in MPOWER standard up to 2016. However, according to Figure 3, its predicted contribution between 2017 and 2025 is the second largest, as it could be improved to the highest MPOWER standard. In contrast, smoke-free law barely works between 2017 and 2025 according to Figure 3, while it was the policy with the second largest contribution between 1998 and 2016, because it is fully compliant with the highest MPOWER standard up to 2016, so there is no further room to improve it after 2016. The above evidence suggests that there is still room to improve and strengthen those policies, especially those at a low or moderate level at 2016.
We should be cautious about interpreting SimSmoke predictions due to limitations inherent to the simulation modelling. The results depend on the reliability of the data, the estimated parameters and the assumptions used in the model. For example, the model did not take into account the effect of immigration. Immigrants to Ireland from Poland had average smoking rates of 48%, significantly higher than Irish prevalence, and 57% brought their cigarettes from Poland16. Therefore, we would expect that it attenuated the effect of tax policy in Ireland at that time.
Another limitation of the study is that the model could not accommodate tobacco control policies beyond MPOWER. For example, the model could not include a ban on smoking in cars with children inside, which came into effect 1 January 2016.
CONCLUSIONS
Prediction from SimSmoke Ireland confirms that the policies implemented between 1998 and 2016 have had considerable effect on reducing smoking prevalence. While implementing policies fully compliant with MPOWER could further reduce smoking prevalence, the predicted prevalence in 2025 would still be above the Tobacco Free Ireland target of 5%. Additional policies stronger than MPOWER will be needed to achieve a Tobacco Free Ireland, indicating that other countries contemplating a Tobacco Endgame will need to go beyond MPOWER.