INTRODUCTION
Tobacco quitlines are telephone hotlines established to assist tobacco users with the process of tobacco cessation1. The 1-800-QUIT-NOW telephone number was established in 2004 to direct callers to appropriate services for individual State quitlines2. In the US, quitlines exist in all States, the District of Columbia, Puerto Rico, and Guam3.
The evidence base for the effectiveness of quitlines is well-established. Proactive telephone-based counseling with multiple calls is recognized as the most effective means of providing cessation support4-6. Similarly, providing free or reduced-cost nicotine replacement therapy (NRT) may increase point prevalence of tobacco cessation at follow-up7,8. More recently, research suggests that NRT provision may increase tobacco cessation rates regardless of self-reported motivation to quit among quitline callers9.
In fiscal year 2016, results of a survey of State quitlines suggest that the average number of minutes of counseling per caller was 15 and the average number of completed counseling calls per caller was two10. In addition, 89% offered free medications to assist in tobacco cessation; the most frequently used forms were nicotine replacement therapies, including nicotine patches, gum, or lozenges10.
As suggested by Prochaska11, the smoking cessation process is measured by five stages of change (Precontemplation, Contemplation, Preparation, Action, and Maintenance). These five stages are primary constructs of the Transtheoretical Model (TM), which describes behavior change as a process that occurs along a continuum rather than a single event (e.g. quit smoking). The TM explains the behavioral processes of changes such as smoking cessation. Although the TM is not part of the minimal dataset for quitlines12,13, it is used in some State quitlines as a measure of progression to cessation.
Not well documented in the literature is whether the stated services provided by quitlines align with the actual services received by clients. If callers are receiving services in doses and time intervals that differ from the intended protocols reported by quitline service providers, variables such as confidence and readiness to quit may be affected, as well as actual cessation rates. This study focuses on one rural State’s quitline in the Midwest region of the US. An out-of-State quitline vendor was responsible for delivering the quitline services during the study period. Services included telephone-based and web-based counseling (an online-only option is available for clients) and, for some callers, free nicotine replacement therapies, including nicotine patches, gum, or lozenges. Although actual services provided to callers vary from caller to caller, the service is proactive (repeated calls with a trained counselor with a set protocol of one month of services with one call per week).
The purpose of this study was to: a) describe the population receiving telephone-based cessation treatment from a rural State tobacco quitline, b) understand the way participants move along the stages of change, and c) identify differences in the way services are intended to be provided and the way services are actually received by that population. The goal is to better understand whether stated service provisions of quitlines align with the actual services received by clients and to explore possible relationships between services provided and cessation rates.
METHODS
The present study was conducted as part of a larger, ongoing evaluation of quitline services that has been conducted continuously since 2008. The data examined in this study came from two sources: 1) intake and treatment data from the out-of-State quitline vendor, and 2) follow-up interview data with individual quitline callers from the external evaluation team. Each month, the quitline vendor sends intake/treatment data for new clients to the evaluation research team for follow-up data collection. Each time intake/treatment data are sent to the evaluation team, participant samples are created monthly by separating the data into 7-month and 13-month follow-up groups. Each month, a random pool of participants is drawn from these samples for follow-up interviews (Figure 1).
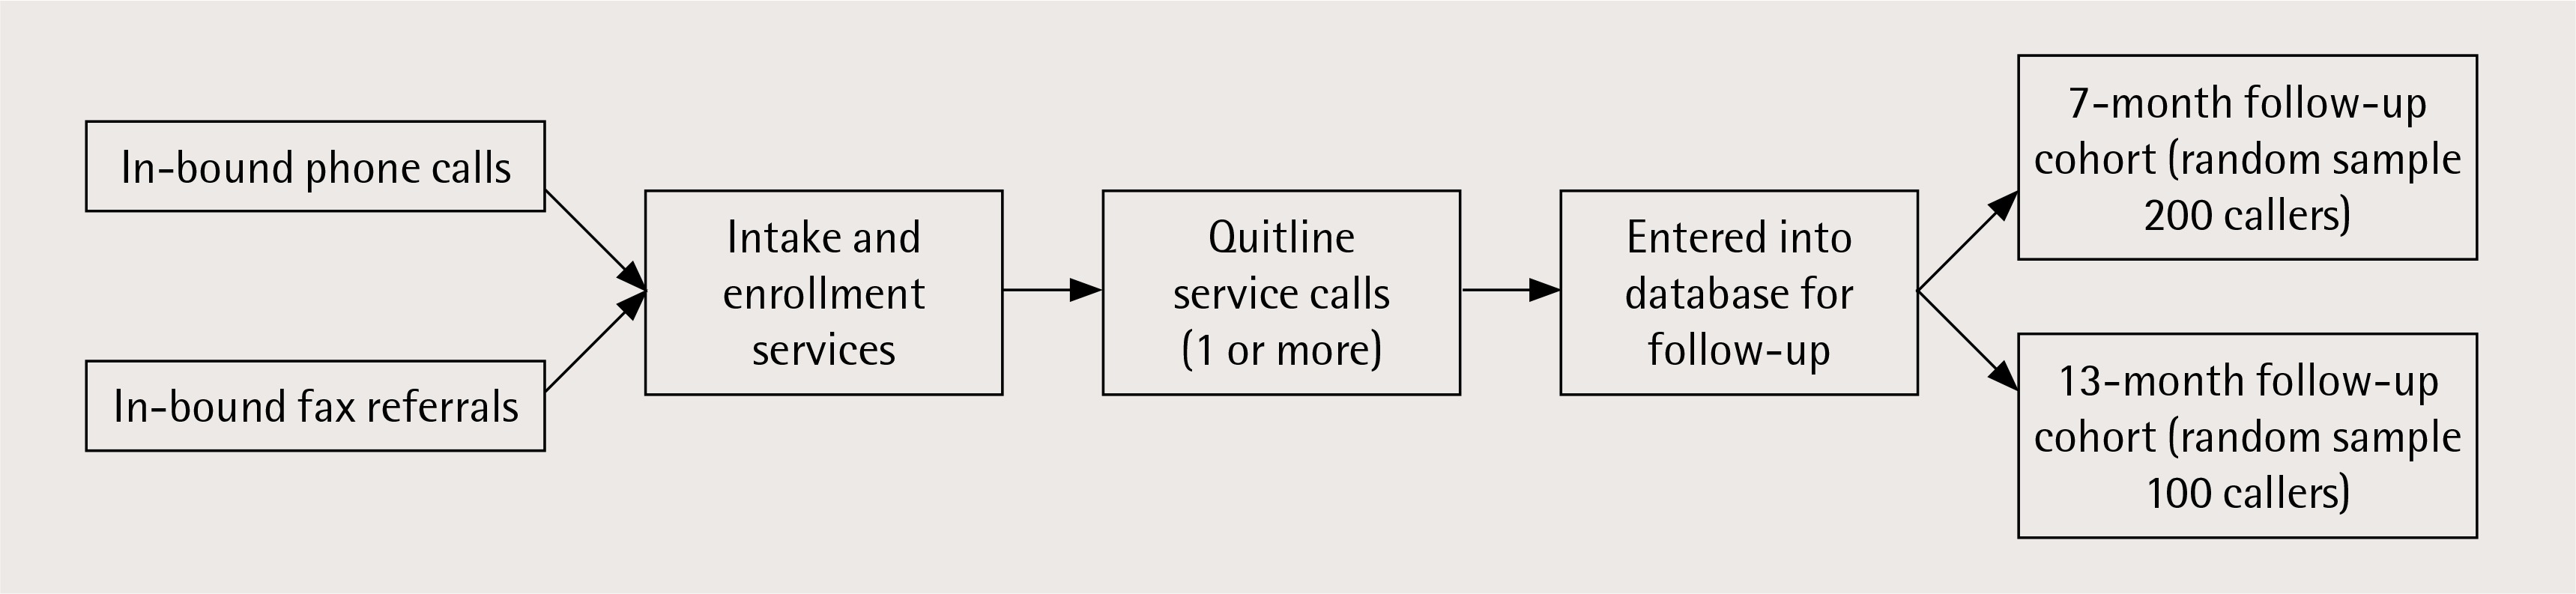
The reference point was the time of intake. This procedure was developed based on the assumption that, for most callers, counseling lasts approximately one month, and it was aligned with NAQC guidelines for conducting follow-up studies13. In addition, a cumulative follow-up sample log was created to avoid duplicated cases in the follow-up within the 12 months prior to and following intake. In order to be part of the follow-up study, respondents had to be 18 years or older, provided a telephone number, and consented to participate in the follow-up study. Follow-up interviews are telephone-based and last approximately ten minutes. After follow-up interviews are conducted, the follow-up and intake data are merged at the caller level. Institutional review board (IRB) approval was obtained for all study procedures.
This study examined the aggregated data from participants reached for a follow-up interview between 1 January 2014 and 5 May 2015. In this period, 6375 callers were randomly selected (7-month cohort: 3507 and 13-month cohort: 2868). Thus, the follow-up response rate during that period was 34.8% for 7-month cohort and 8.1% for 13-month cohort, with an overall response rate of 22.9%; these rates are consistent with those of the previous five years in the State.
Data management and analysis were conducted with SPSS 22. Descriptive and bivariate analysis such as chi-squared and t-test were used. Effect sizes (Cramer’s V and Cohen’s d) were calculated to assist in contextualizing the findings.
Measures used in this study were quit rate, quit duration, length of services, number of services, stage of change, confidence to quit, and source of referral. Quit rate was measured by the follow-up question: ‘Have you smoked any cigarettes or used other tobacco, even a puff or pinch, in the last 30 days?’. Response options were: 1) Yes, and 2) No. Quit duration (time since last cigarette) was assessed at the last service call. The response options were: 0) not collected, 1) less than 7 days, 2) 7 days to less than 1 month, 3) 1 month to less than 6 months, and 4) 6 months or more. Length of the service provided was defined as the number of days between intake call (1st call) to last service call. Number of service instances was defined by the total number of calls minus one (the intake call, at which no counseling was provided). Stage of change was defined on the five-point Likert scale from: 1 = Precontemplation to 5 = Maintenance. The confidence to quit was assessed during the last service call and ranged from: 1 = low confidence to 10 = high confidence. This was recoded into: 1) Low = 1–3 confidence, 2) Medium = 4–6 confidence, and 3) High = 7–10 confidence. Source of referral was defined as: 1) Telephone (those who called to the services by themselves), and 2) Fax (referred via fax by health care providers).
RESULTS
Comparison between intake and follow-up participants
In the study period, there were 21002 intakes to the quitline service. Of these intakes, 5791 callers were sampled and 1452 of them participated in a follow-up assessment. Participants in the follow-up were more likely to have higher level of education [χ2(3)=15.90, p=0.001, Cramer’s V=0.033], more likely to be older [χ2(5)=135.37, p<0.001, Cramer’s V=0.089], and more likely to be single [χ2(2)=21.26, p<0.001, Cramer’s V=0.041]. The Cramer’s V effect sizes were very small for these demographic variables.
The demographic characteristics of the callers in the intake and follow-up groups are shown in Table 1. The mean age at the time of intake was 44.9 years (SD=13.0) and the mean age at the time of follow-up was 48.6 years (SD=12.3) [t(17,254)=11.52, df=17, 254; p<0.001, Cohen’s d=0.30, 95% CI: 0.23–0.34]. The majority of follow-up respondents were male (60%) and 52% had a high school diploma, GED, or less. Most respondents were non-Hispanic and White. Regarding type of referral to the quitline, 65% were referred via fax by a healthcare provider and 30% were inbound telephone callers (other types of contact can be seen in Table 1).
Table 1
Demographic characteristics of the follow-up and intake samples in the State quitline services
Follow-up participants’ tobacco use (cigarette, cigars, e-cigarettes, smokeless tobacco, or any other tobacco) was significantly higher compared to callers in the intake [94.6% vs 68.7%, χ2(1)=436.22, p<0.001, Cramer’s V=0.144]. In addition, smoking more than 20 cigarettes per day (a measure of heaviness of smoking) was higher among follow-up participants than those at intake [18.7% vs 12.6%, χ2(3)=175.44, p<0.001, Cramer’s V=0.091]. The average number of cigarettes smoked per day among follow-up participants was 16.8; among intake participants the average number of cigarettes smoked per day was 12.2 (p<0.001). Follow-up participants’ e-cigarette use was significantly higher compared to the intake group [11.4% vs 9.1%, χ2(1)=7.56, p=0.007, Cramer’s V=0.023]. The Cramer’s V effect sizes for these variables were small.
Follow-up participants
Regarding services received by follow-up respondents (Table 2), treatment data provided by the quitline vendor show that the average number of telephone contacts was 6.9 and the average number of days in treatment with the quitline was 106.8 (approximately 3.5 months). At the last contact with the quitline, motivation to quit and confidence in quitting were, on average, rated by respondents as 8.8 and 8.2, respectively, on a ten-point scale.
Table 2
Treatment details of those enrolled in the State quitline (N=1452)
Although the majority of respondents (77%) enrolled in services only once, 17% enrolled twice and 6% enrolled three or more times. At intake, most respondents (88%) reported being in the Preparation stage of change. At the most recent treatment call, 65% were in the Action stage of change. At the most recent call with the quitline, 48% of those asked had been tobacco-free for one to six months (although this information was not collected by the quitline vendor from over 26% of callers).
Comparison by cessation status at follow-up
At follow-up, 28% of respondents reported that they had been tobacco-free in the past 30 days (Table 3). Most (68%) reported using a medication to help them quit and 31% reported using e-cigarettes instead of regular tobacco. Slightly less than half (44%) reported being Very satisfied with services.
Table 3
Follow up responses among those who had been enrolled in the State quitline
There were differences in quit rates based on gender and marital status. Among males, 32% were tobacco-free at follow-up compared to 26% of females, [χ2(1)=5.8, p=0.016, Cramer’s V=0.06]. Regarding marital status, 35% of the callers who were married or in a domestic partnership were tobacco-free at follow-up compared to 24% of single, widowed, divorced, or separated respondents, [χ2(2)=17.4, p<0.001, Cramer’s V=0.08].
The length of treatment in months received by those who had not quit at follow-up (M=3.7, SD=2.5) was longer than that received by respondents who had (M=3.3, SD=2.2) [t(1,449)=2.40, p=0.02, Cohen’s d=0.14, 95% CI: 0.03–0.26]. There was no difference in number of treatment calls between the two groups.
There was no difference in tobacco cessation success by referral type (phone/web inbound contacts versus fax referrals). However, there was some difference in satisfaction level. Respondents who were phone/web inbound clients were more likely to report being Very satisfied or Mostly satisfied with the quitline services received (75%) than respondents who were fax referral clients (66%), [χ2(1)=18.7, p<0.001, Cramer’s V=0.09].
Likelihood of cessation at follow-up was positively associated with reported duration without tobacco at the last quitline call. Among those who reported they had been tobacco-free for less than 24 hours at the last quitline call, 23% were tobacco-free at follow-up. Among those who reported they had been tobacco-free for more than 24 hours and less than 7 days at the last quitline call, 20% were tobacco-free at follow-up. Among those who had reported they had been tobacco-free for at least one week, 35% were tobacco-free at follow-up, [χ2(2)=12.3, p<0.002, Cramer’s V=0.08].
Bivariate analysis between the time periods of intake, last call with the quitline, and follow-up suggest differences between those who quit successfully (defined as no tobacco use in the past 30 days at follow-up) and those who did not. The shift in self-reported stage of change was measured by computing the difference between the first and last recorded stages of change during the quitline treatment period. About one-third (38%) did not move to a higher stage; 2% actually regressed to an earlier stage. The majority (58%) moved to the next stage of change. When comparing those who did not move to a higher stage (unchanged) and those who did (positively changed), chi-squared tests indicated that improvement in the stage of change was associated with a significantly greater likelihood of being tobacco-free at follow-up.
At follow-up, when comparing respondents who quit tobacco with those who did not quit, satisfaction of services was significantly higher among those who quit [χ2(3)=122.0, p<0.001, Cramer’s V= 0.29]. Use of medication was also significantly higher among those who quit [χ2(1)=7.1, p=0.009, Cramer’s V= 0.07]. On the other hand, use of e-cigarettes to help quit was significantly lower among those who quit at the time of follow-up [χ2(1)=31.5, p<0.001, Cramer’s V=0.15].
When looking at the association between confidence to quit and stage of change, respondents who quit at the time of the follow-up were significantly more likely to have reported a higher confidence to quit at intake [χ2(1)=24.1, p<0.001, Cramer’s V=0.13]. Also, respondents were significantly more likely to have made a positive progression in the stage of change while in quitline calls [χ2(1)=43.4, p<0.001, Cramer’s V=0.18], and have reported Action or Maintenance stage of change at the last call [χ2(1)=69.8, p<0.001, Cramer’s V=0.22].
DISCUSSION
The results of this study suggest that although more than one-fourth of respondents (28%) reported being tobacco-free at follow-up, important inconsistencies exist between the stated and actual treatment models, which may impact quit rates. Treatment data provided by the quitline vendor indicate that the actual treatment model differs from the stated treatment model. Callers to the quitline are not receiving just one month of treatment; they are receiving, on average, more than three months of treatment. In addition, they are re-enrolling (sometimes several times) to receive additional services from the quitline. This treatment length has an important implication for the follow-up data collection procedures because the follow-up assessments are in fact, on average, 3 and 9 months after the end of calls instead of 6-month and 12-month follow-ups.
There were statistically significant differences between those who had quit and those who had not. This was true for some demographic characteristics, such as gender and marital status, but also for treatment variables (such as length of service) and psychological variables (such as self-reported confidence and stage of change). Also, there were several factors related to cessation, such as use of medication, use of e-cigarettes, confidence to quit, and stage of change measure. While these differences were statistically significant, effect sizes suggest that the variables with the strongest associations with cessation rate at follow-up are the participant’s stage of the change at the last call and the participant’s progression while receiving quitline services.
Limitations are present in this study. This study represents the experience of one rural State and may not be representative of the experiences in other States. The response rate in this study is below the national average10. In addition, the follow-up respondents compared to the intake respondents also shows statistically significant differences in some of the demographics and key measures, such as cigarette use. However, the magnitude of effect sizes are very small, and these differences may not have a practical difference.
Data cut-off points at the beginning and end of the study period created a lag so that for some follow-up respondents, intake data are missing, and for some intake respondents, services were not yet complete (thus, service and follow-up data were not available). However, the large sample size and extensive data cleaning procedures helped to mitigate that issue. All intake and follow-up data are based on self-reports from respondents. This may introduce bias to the findings. In addition, the longer-than-expected length of services received by quitline callers changed the reality of the follow-up period. In theory, a one-month treatment period led to 6-month and 12-month follow-up periods, with a 7-month and 13-month lag from intake to follow-up. However, the approximately 3-month treatment period meant that the follow-up lag was actually reduced to approximately 3-month and 9-month follow-up periods. This limitation is meaningful because many State quitline evaluations assume a one-month treatment period. In truth, this may be an inaccurate assumption and may lead to follow-up calls with individuals who are in fact still actively receiving treatment.
CONCLUSIONS
Study findings related to stage of change and associations between confidence and actual cessation may have meaningful implications for service provision. The critical factor in cessation success may not be length of treatment but what is accomplished during treatment and the intersection of clients’ motivation, satisfaction, confidence, and cessation status at the end of treatment. Thus, setting a treatment plan within a month may not be the best approach; focusing on specific goals and objectives to achieve within treatment could be a more effective strategy.