INTRODUCTION
Cigarette manufacturers use brand names and descriptors to communicate characteristics of their products, such as sensory features and nicotine delivery1,2. Compared to plain packs, packs carrying descriptors and brand imagery are perceived as having a smoother taste, better quality, delivering more tar, more attractive, and more appealing to youth3-6. Many government agencies, including the U.S. Food and Drug Administration (FDA), have restricted certain descriptors such as ‘low’, ‘light’, and ‘mild’, in part due to their potential to mislead consumers about the health risks of associated brands, despite no association with reduced health risk7,8. However, misperceptions of the health risks of ‘light’ cigarettes continue3,9-13. This may be due to the use of colors, numbers, or other descriptors replacing these targeted terms and a possible lack of smokers noticing changes to their packs after the removal of the specific descriptors14-18. Notably, the ban on ‘light’ descriptors has not affected uptake, use, or the market share of ‘light’ cigarettes14, likely due to the substitution of color descriptors.
Pack color, design, and descriptor term influence perceptions of risk and intentions to use3,4,15,19,20. For instance, smokers reported different tastes when smoking identical cigarettes that were presented in different cigarette packs21. In some cases, cigarette manufacturers removed restricted terms and replaced them with color descriptors, often colors that were already associated with the sub-brand (e.g. Marlboro Light became Gold)16. Pairing these new descriptors with specific product characteristics (e.g. filter ventilation) led to smokers continuing to consider cigarette brands as ‘light’ or ‘mild’3,10,12,13. Colors also have functions in marketing with respect to sensory perceptions22. More white space and lighter colors reduced perceptions of strength23, and Marlboro cigarettes in red packs were perceived as harsher than in blue packs24.
In addition to colors, other brand descriptors such as ‘smooth’ remain on cigarette packs. As with colors, these alternative descriptors continue the misperception of lower harm of certain cigarette brands, particularly among adolescents and young adults4,5. In adult smokers, descriptors such as ‘smooth’ are perceived as delivering less tar, having a smoother taste, and having lower health risk compared to packs labeled as ‘full flavor’3. Today, smokers increasingly rely on pack colors and other descriptors to determine product features and identify preferred cigarette brands11.
In marketing, branding defines how a product is intended to be perceived. A brand uses a unique design, sign, symbol, word, or a combination of these, to attempt to create an image that identifies a product and differentiates it from its competitors. Branding is a core component in increasing the appeal of a tobacco product. Appeal for tobacco products can be conceptualized as willingness to try a product that is mediated by other factors such as abuse liability (e.g. delivery of nicotine, sensory effects, and taste) and consumer perception (e.g. knowledge, beliefs, social influence)25.
There is growing evidence that product harm perceptions are associated with different product descriptor terms and packaging colors3,11,12,15,20,26. However, research is needed to evaluate how specific descriptors and colors affect consumer perceptions of product harm and appeal. This is particularly important in the US context where the law mandates that FDA regulates the marketing of tobacco products so that consumers are not misled27.
The current study examines how product descriptors influence consumers’ perceptions of cigarettes, using four classes of brand descriptors as suggested by Hoek et al.26 : 1) prestige, which defines a brand’s status, 2) connotation (which attempts to portray a brand image), 3) taste, and 4) color. Within each of these categories, we examined how different product descriptors ranked with respect to attractiveness, harmfulness, and appeal.
METHODS
Participants
Eighty-eight participants completed the study at three sites:
Roswell Park Comprehensive Cancer Center (Buffalo, NY; n=39),
Harvard Chan School of Public Health (Boston, MA; n=20),
and Medical University of South Carolina (Charleston, SC; n=29).
Participants were recruited from May 2018 to July 2019 via local newspapers, websites, and social media platforms. Inclusion criteria were: 1) aged 18–39 years (21 in Boston due to minimum age of purchase laws), 2) smoke ≥5 factory-made filtered cigarettes/day for ≥1 year, 3) ‘fair’ or better self-rated physical and mental health, and 4) English-speaking. Exclusion criteria were: 1) active cessation efforts or plans to quit in next 30 days, 2) regular use of other nicotine products, 3) past year binge drinking or illegal drug use, and 4) pregnancy. Data were collected regarding participant demographics, tobacco use history, nicotine dependence (FTCD: Fagerström Test for Cigarette Dependence)28 and behavioral aspects of cigarette dependence (GN: Glover-Nilsson Scale)29. All participants provided informed consent and participant confidentiality was maintained.
Design
We evaluated brand descriptors within four classes of brand features: prestige (i.e. brand status), connotation (i.e. brand image), taste, and color (see Table 1 for descriptors within each class). The primary dependent variables were rankings of harm, attractiveness, and appeal (defined as willingness to try) perceptions of descriptors within each brand feature. Rankings of harm and attractiveness were intended to reflect perceived product characteristics, while appeal was intended to reflect behavioral intentions (i.e. likely to try).
Table 1
Descriptors used within each four cigarette brand features
Procedure
Participants attended one in-person semi-structured interview that lasted 45 minutes. An interviewer at each site followed a standardized discussion guide to ensure consistency across sites. Each interview included discussions about cigarettes in general, and questions designed to address product awareness, reasons for use, risk perceptions, and perceptions about marketing. The interviewers then pursued a more in-depth conversation to elicit perceptions surrounding brand descriptors and colors. Finally, participants engaged in a task to rank the perceived harm, attractiveness, and appeal of each descriptor within each brand feature. For example, the five prestige descriptors were ranked from 1 to 5 for harm, attractiveness, and appeal separately. This process was repeated for the taste, connotation, and color descriptors. Descriptors were presented to participants in a randomized order. All procedures were approved by the Roswell Park Comprehensive Cancer Center Institutional Review Board.
Data analysis
Participant demographics and smoking history were assessed with descriptive analyses and were compared across study sites using chi-squared test and one-way ANOVA. Data from the three sites were pooled for further analyses to increase sample diversity, given that all sites are in the same cigarette market (e.g. same labelling rules). The independent variables in the study were the brand descriptors, analyzed separately for each brand feature (i.e. prestige, taste, connotation, color). The primary dependent variables analyzed in the current study were the ranked perceptions of harm, attractiveness, and appeal. Perceptions of appeal and attractiveness were reverse coded such that higher ranks indicated more positive consumer perceptions (i.e. lower harm, greater appeal, more attractive). Descriptive analyses were used to generate radar plots that depict median rankings for each descriptor and stacked bar charts showing the per cent of participants that ranked descriptors as the most/least harmful, attractive, or appealing. Additionally, chi-squared was used to assess for demographic differences in descriptor rankings (p<0.01). These analyses were considered exploratory and a stricter p value (0.01) was used in place of more formal adjustments. Demographic factors included age (median split: 19–32, ≥33), sex (male, female), race (White, Non-White), education (≤ high school diploma, some college +), and nicotine dependence (low: FTCD ≥4, moderate-high: FTCD ≥5). Spearman’s correlations (p<0.05) were used to assess the correlation between rankings of harm, appeal, and attractive within each descriptor category individually (i.e. separate analyses for prestige, connotation, taste, color) and across all descriptor categories (i.e. all descriptors combined).
RESULTS
Participant demographics
Table 2 gives demographic characteristics and tobacco use history among the full sample and by study site. Participants at each study site did not differ on smoking characteristics such as cigarettes/day, years smoking usual brand, FTCD scores, or GN scores (all F<2.68, p>0.05), though they did differ on age, race, education, and income (all p<0.05).
Table 2
Participant demographic and smoking characteristics
Rankings of descriptors
Radar plots demonstrating the aggregated median rankings of harm, attractiveness, and appeal for prestige, taste, connotation, and color descriptors are displayed in Figure 1. Figure 2 summarizes findings in four stacked bar charts which display the percentage of participants that ranked each descriptor as the most or least harmful, attractive, and appealing. Table 3 summarizes the most/least harmful, attractive, and appealing descriptors based on median and per cent ranking.
Figure 1
Radar plots demonstrating the aggregated median rankings of harm, attractiveness, and appeal for prestige, taste, connotation, and color descriptors
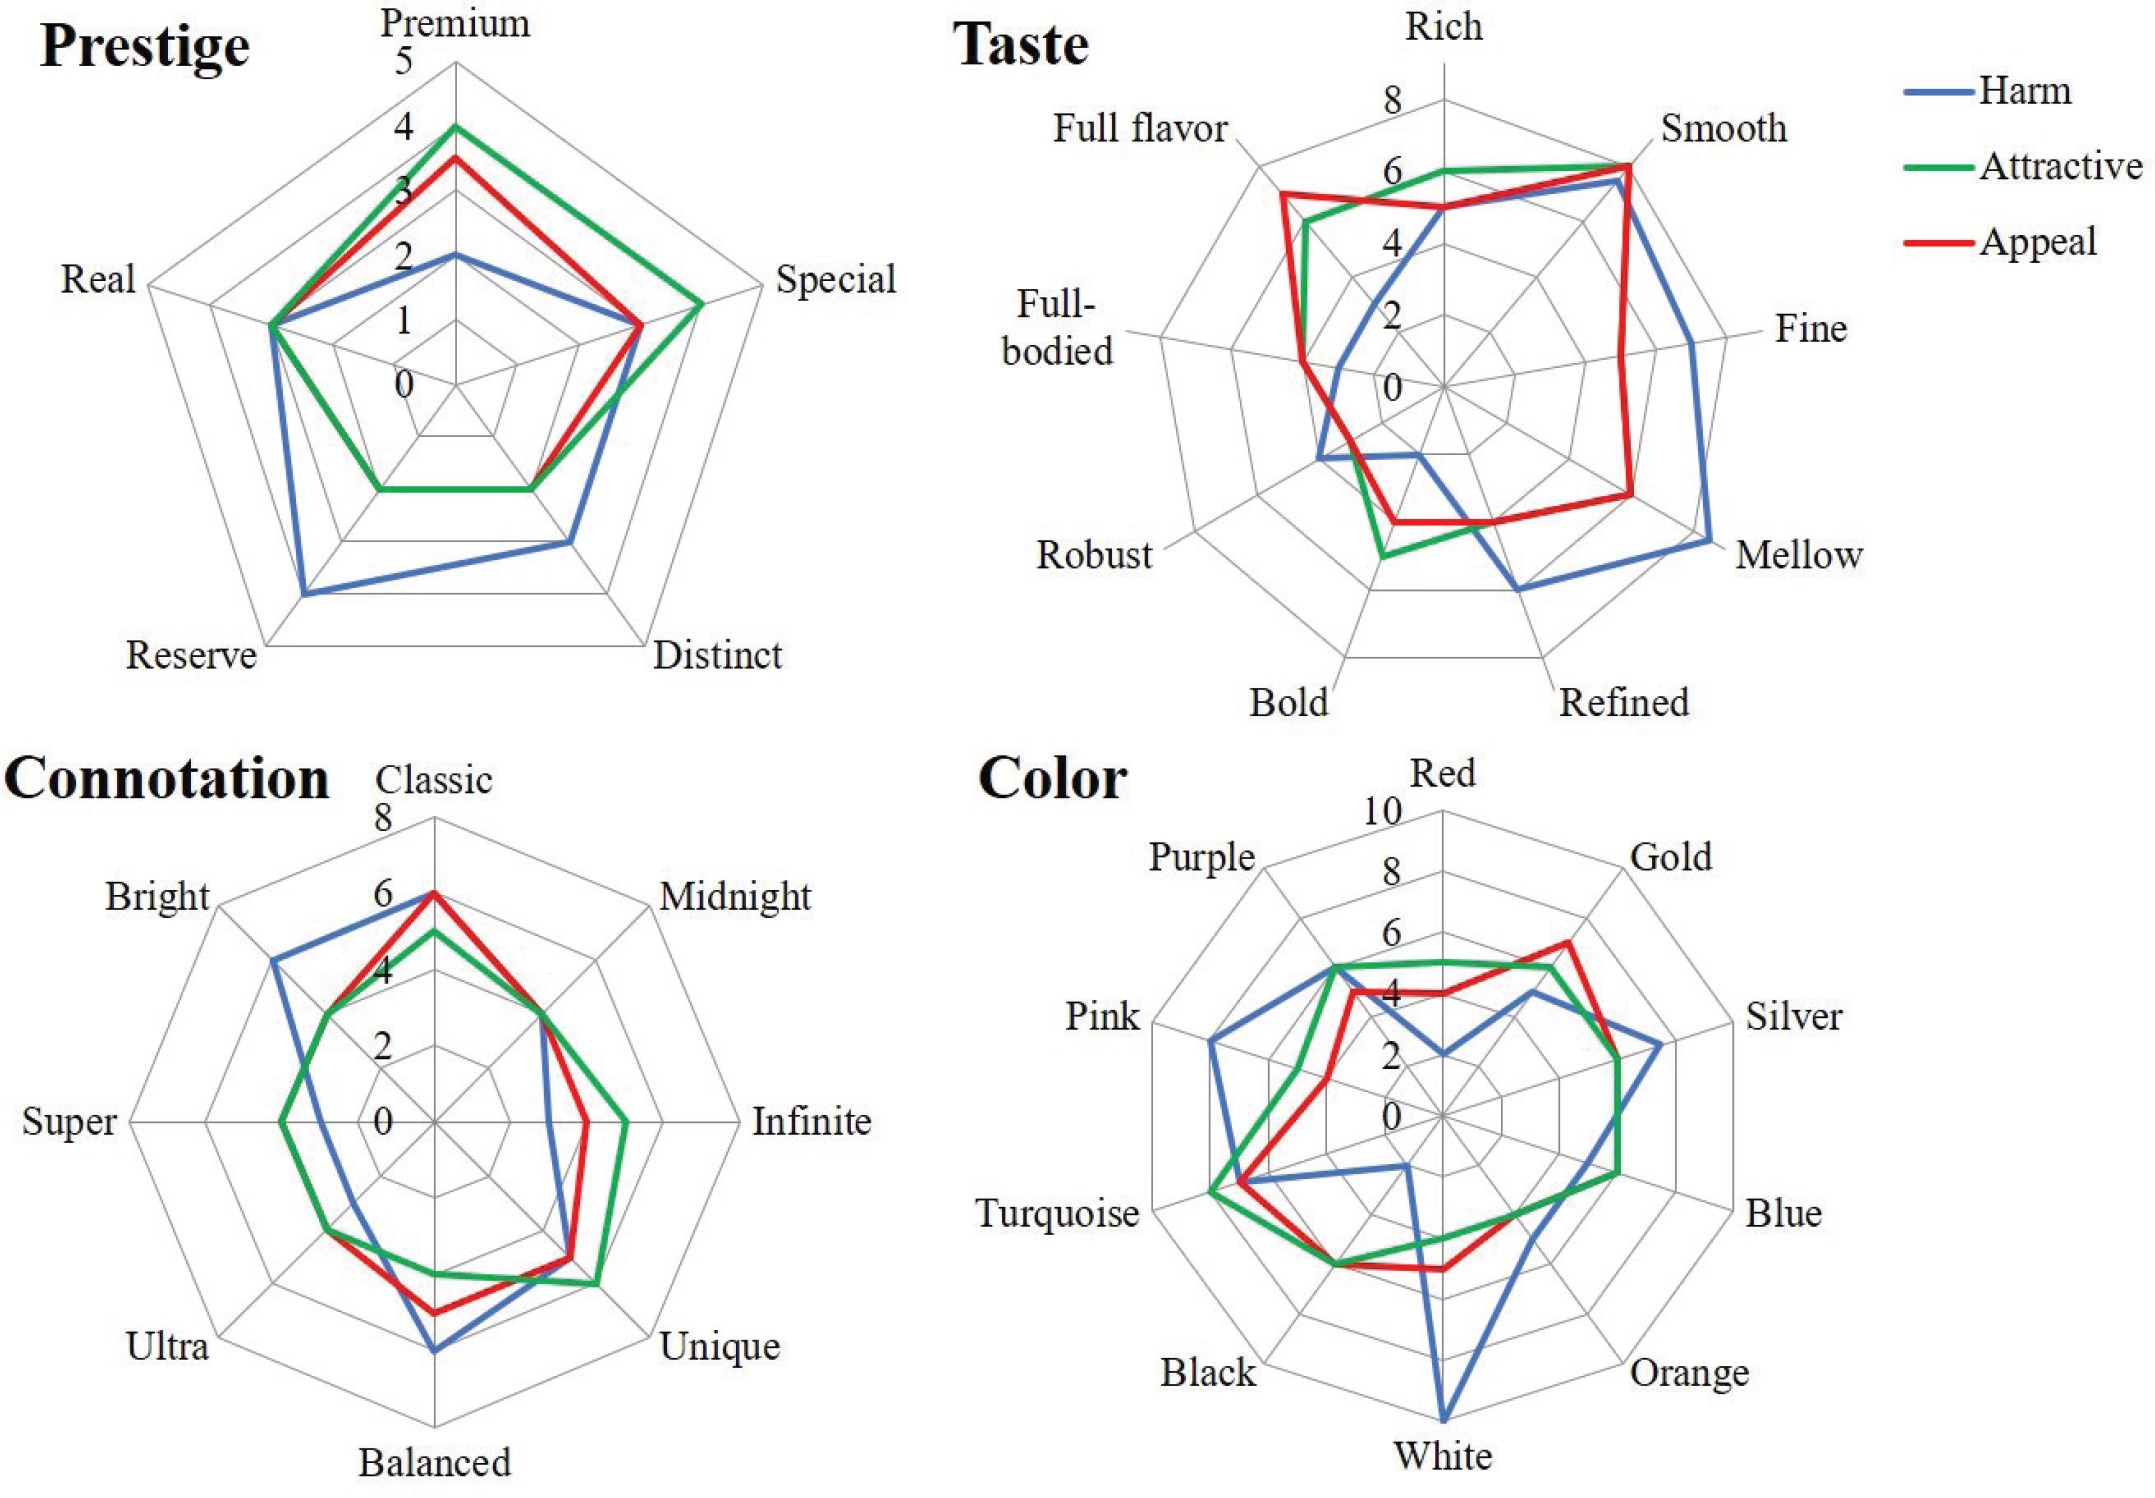
Figure 2
Stacked bar charts which display the percentage of participants that ranked each descriptor as the most or least harmful, attractive, and appealing
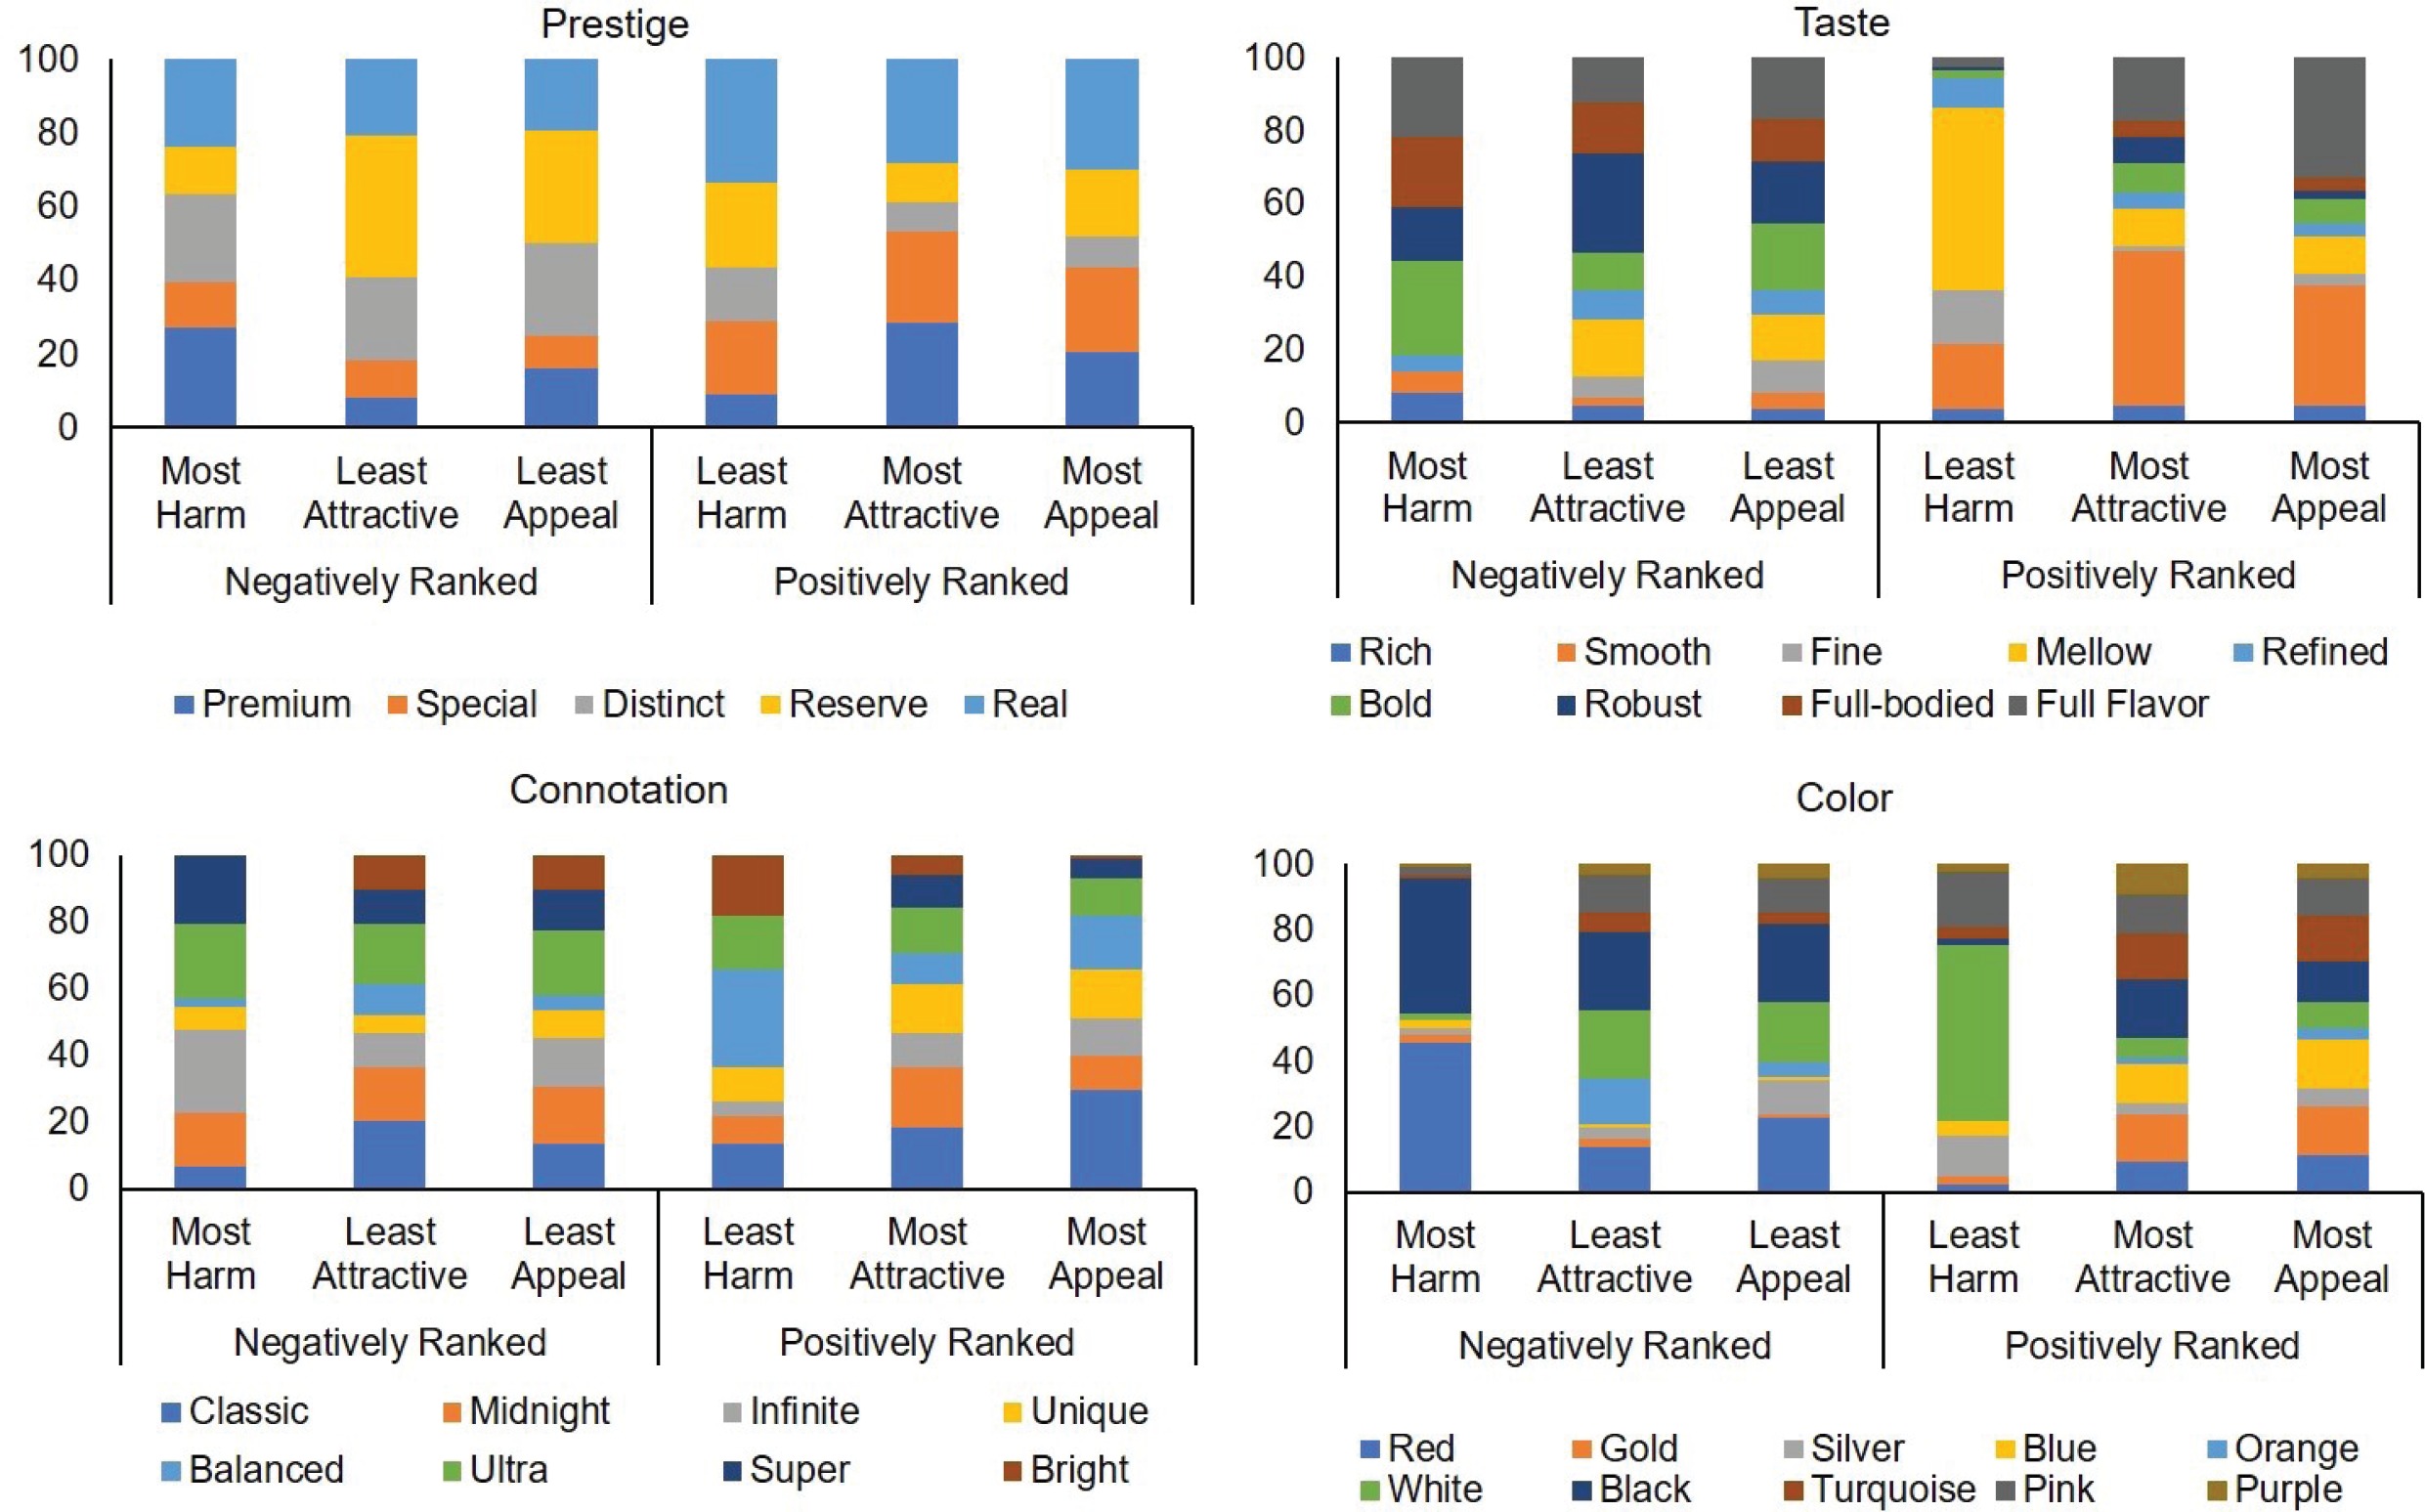
Table 3
Least/most harmful, attractive, and appealing descriptors based on median rankings and percentage of participant rankings
Prestige
Visual inspection of the radar plots shown in Figure 1 suggests that median rankings of a product’s harm, attractiveness, and appeal were most similar for three descriptor labels: Real, Special, and Distinct. Rankings diverged most for two descriptors: Premium and Reserve. For example, median rankings of harm were higher (less harmful) for Reserve compared to rankings of attractiveness and appeal, while the opposite was observed for Premium. As summarized in Table 3, median rankings of attractiveness overlapped with rankings of appeal more than rankings of harm and appeal.
Median rankings of harm for prestige descriptors ranged 2–4. Median rankings indicated that Reserve was perceived as least harmful (i.e. highest ranking) and Premium was perceived as most harmful (i.e. lowest ranking) (Figure 1 and Table 3). This finding is consistent with the 27.2% of participants ranking Premium as most harmful and 9.2% ranking it least harmful. Real was ranked least harmful by more participants than other prestige descriptors (33.3%), despite lower median rankings than Reserve. Reserve and Special were ranked as most harmful by fewer participants (12.5%) than other prestige descriptors.
The range of median rankings of attractiveness was 2–4 across prestige descriptors (Figure 1 and Table 3). Rankings of attractiveness were highest for two descriptors: Special and Premium, and lowest for Reserve and Distinct. Premium and Real were ranked most attractive by more participants than any other descriptor. Premium and Special were ranked least attractive by fewer participants than other descriptors (8.0% and 10.2%, respectively). Reserve was ranked least attractive by the most participants (38.6%) and ranked most attractive by only 8.0% of participants.
The range of median rankings for appeal was 2–3.5 across prestige descriptors. Median rankings of appeal (willingness to try) were highest for Premium and lowest for descriptors Distinct and Reserve (Figure 1 and Table 3). Real was ranked by the most participants as most appealing (29.9%), followed by Special (23.0%). Special was also ranked least appealing by the fewest participants (9.1%). Reserve was most ranked least appealing by the most participants (30.7%), followed by Distinct (25.0%).
Taste
The radar plot for taste shows more variation in median rankings within descriptors than was observed for prestige descriptor labels (Figure 1). Similar median rankings of harm, attractiveness, and appeal were observed within the descriptors Smooth, Robust, Rich, and Full-bodied. Fine, Mellow, Refined, and Robust were ranked less harmful (higher median) compared to their median rankings of attractiveness and appeal. Full flavor, Full-bodied, and Bold were ranked more harmful than their rankings on attractiveness and appeal. Overall, aggregated median rankings of attractive and appeal are more consistent with each other than with rankings of harm.
Median rankings of taste descriptors on harm had a wide range of scores from 2 to 8.5. Median rankings indicated that Mellow was perceived as least harmful and Bold as most harmful (Figure 1 and Table 3). Mellow was never ranked most harmful and was ranked least harmful by 50.0% of participants; whereas Bold was ranked most harmful by 26.1% and least harmful by only 2.3% of participants. No participants ranked Full-bodied as least harmful and no participants ranked Fine or Mellow as most harmful.
Median rankings of descriptors on attractiveness also had a wide range of scores from 3 to 8. Median rankings of attractiveness were highest for Smooth and lowest for Robust (Figure 1 and Table 3). Smooth was ranked most attractive by 42.5% and least attractive by only 2.3% of participants. By contrast, Robust was ranked least attractive by 27.3% of participants. Taste descriptors such as Rich, Fine, Refined, and Bold were rarely ranked as most or least attractive.
Like attractiveness, median rankings of descriptors on appeal ranged from 3 to 8, with Smooth ranked as most appealing and Robust ranked as least appealing (Figure 1 and Table 3). Smooth was ranked most appealing by 33.0% of participants, and least appealing by only 3.4% of participants. Full flavor was ranked most appealing by 33.0% of participants, but also least appealing by the second highest number of participants (17.0%). Robust was ranked most appealing by the fewest participants (2.3%).
Connotation
Though there is notable variation in median rankings of harm, attractiveness, and appeal within some connotation descriptors, the range of scores is not as large as observed for taste descriptors (Figure 1). For example, median rankings of harm for Bright and Balanced were higher (less harmful) than attractiveness and appeal, though this difference was only one to two ranking positions. The opposite pattern of results was observed for Super, Infinite, and Ultra.
Median rankings of harm for connotation descriptors had a narrower range than in the taste category, range 3–6. Median rankings indicated that Balanced, Bright, and Classic were perceived as least harmful, while Super, Ultra, and Infinite were perceived as most harmful (Figure 1 and Table 3). Twenty-nine per cent of participants ranked Balanced as least harmful and only 2.3% as most harmful. No participant ranked Super as least harmful or Bright as most harmful.
Median rankings of attractiveness for connotation descriptors were narrower than for harm rankings, range 4–6. Median rankings for attractiveness showed that Unique was ranked most attractive while Ultra, Midnight, Balanced, Super, and Bright were ranked least attractive (Figure 1 and Table 3). This result is consistent with highest and lowest ranking frequencies, in which no descriptor was rated as most or least attractive by more than 20.5% of participants. Some descriptors had comparable number of participants ranking them as least and most attractive such as Classic (10.2%), Infinite (10.2%), and Balanced (9.1%).
Median rankings of connotation descriptors on appeal follow the same pattern as attractiveness rankings, with a narrow range of scores from 4 to 6. Classic had the highest median appeal ranking while Bright, Super, Ultra, Infinite, and Midnight were ranked least appealing (Figure 1 and Table 3). Classic was the only descriptor ranked as most appealing by >20% of participants, 29.5% rated Classic as most appealing. Bright scored lowest on appeal by participants, ranked as most appealing by only 1.1% of participants.
Color
The discrepancies between mean rankings of harm, attractiveness, and appeal seem larger for color than other brand features based on inspection of the radar plot (Figure 1). Still, some descriptors show converging results for all three outcomes (e.g. Turquoise, Purple). Generally, rankings of attractiveness and appeal were more similar than rankings of harmfulness. Rankings of harm substantially diverged from attractiveness and appeal for Red, White, Black, and Pink.
Median rankings of harm for color descriptors had a wide range of scores from 2 to 10. Median rankings demonstrated that White was ranked least harmful, the colors Red and Black were ranked most harmful (Figure 1 and Table 3). Red and Black were ranked most harmful by the largest proportion of participants (45.4% and 40.9%, respectively), while all other color descriptors were ranked most harmful by <3% of participants. Orange was never ranked as most or least harmful. White was ranked as least harmful by 53.4% of participants, which was the largest percentage of any ranking across all descriptors.
Median rankings of color descriptors on attractiveness had a narrower range compared to harm rankings, range 4–8. Turquoise had the highest median attractiveness ranking, Orange and White were ranked as least attractive (Figure 1 and Table 3). However, no color descriptors were ranked most attractive by many participants. More variation was observed in least attractive rankings, with the colors Black and White most commonly ranked least attractive (24.1% and 20.7%, respectively). In contrast, Blue was ranked least attractive by only 1.1% of participants.
Median rankings of color descriptors on appeal ranged 4–7. Turquoise and Gold had the highest median appeal rankings. Orange, Red, and Pink were ranked least appealing (Figure 1 and Table 3). There was no color descriptor that was consistently ranked as most attractive (range: 3.4–14.8%). By contrast, Black and Red were most often nominated as least appealing (23.9% and 22.7%, respectively). Blue and Gold were nominated as least appealing by only 1.1% of participants.
Correlation between harm, appeal, and attractiveness
Among all descriptors combined, rankings on harm were weakly correlated with appeal [r(2805)=0.20] and attractiveness [r(2791)=0.17, p<0.001], i.e. lower harm rankings were associated with higher rankings for appeal and attractiveness. Appeal and attractiveness rankings also were strongly correlated [r(2789)=0.63, p<0.001].
Among prestige descriptors, harm was positively correlated with appeal [r(435)=0.25, p<0.001] but not attractiveness [r(436)=0.09, p>0.05]. Additionally, appeal and attractiveness were correlated [r(435)=0.53, p<0.001]. Among taste descriptors, harm was weakly associated with appeal [r(786)=0.13] and attractiveness [r(785)=0.15]; appeal and attractiveness were strongly correlated [r(783)=0.66, p<0.001]. Among connotation descriptors, harm was weakly correlated with appeal [r(700)=0.12, p<0.001] but not attractiveness [r(699)=0.03, p>0.05], appeal and attractiveness were moderately associated [r(699)=0.47, p<0.001]. Among color descriptors, harm was not correlated with appeal [r(877)=0.06] or attractiveness [r(865)=0.05, p>0.05], however, appeal and attractiveness were strongly correlated [r(866)=0.62, p<0.001].
Interactions with demographics
Age
Age effects were observed for Midnight (connotation), with 25% of older participants ranking Midnight as most harmful (59.1% top 3), compared to 6.8% of younger participants (20.4% top 3) [χ2(7)=21.75, p=0.003]. More younger participants ranked Midnight as moderately harmful, with 52.3% ranking it as 4th and 5th most harmful compared to 11.3% of older participants. Attractiveness rankings of Turquoise (color) also differed by age, though distinct differences did not emerge [χ2(9)=22.18, p=0.008]. For example, 20.5% of older participants ranked Turquoise as most appealing versus 6.8% of young participants, but this pattern was the opposite for second-most appealing (20.5% younger vs 4.5% older).
Sex
Females more commonly ranked Pink (color) as most attractive (18.9% vs 0%) and top 3 (39.6% vs 2.9%), while males more commonly ranked Pink as least attractive (20.6% vs 5.7%) [χ2(9)=26.55, p=0.002]. A similar trend was observed for appeal rankings of Pink, though the stricter cutoff for statistical significance was not met (p=0.034).
Race
Harm perceptions of Smooth (taste) differed by race, with Non-White participants ranking Smooth as the least harmful more frequently than White participants (35.5% vs 8.8%) [χ2(7)=29.43, p<0.001].
Education
Harm rankings of Rich (taste) differed by education, with participants with less education more commonly rating Rich as most harmful (17.6% vs 1.9%) and less commonly ranking Rich in the middle position (26.5% vs 51.9%) compared to participants with more education [χ2(8)=24.76, p=0.002].
Nicotine Dependence
Dependence scores influenced appeal rankings of Silver (color), as lower dependence participants were more likely to rank Silver as top 3 appealing than higher dependence participants (32.7% vs 15.1%) [χ2(9)=25.25, p=0.003]. Higher dependence participants were more likely to rank Silver as least appealing (18.2% vs 5.5%), though this trend was opposite for second-least appealing (3.0% vs 14.5%).
DISCUSSION
The current study assessed how different brand descriptors can influence perceptions of harm, attractiveness, and appeal, revealing three key findings. First, specific brand descriptors have varying degrees of influence on consumer perceptions of cigarette harm, attractiveness, and appeal. This finding was true regardless of the brand feature (i.e. prestige, taste, connotation, color). Some descriptors (e.g. Smooth) had favorable perceptions across all outcomes, while other descriptors (e.g. Red) had more negative perceptions. Second, perceptions of appeal were more strongly associated with perceptions of attractiveness than perceptions of harm. Third, demographic or baseline characteristics may influence perceptions of specific descriptors, indicating that the meaning of descriptors may change depending on the individual.
Perceptions of appeal were more strongly associated with perceptions of attractiveness than harm, which was observed overall and within each brand feature. For some brand features, such as color, perceptions of harm and appeal were not significantly correlated, and weak or no correlations existed between perceptions of harm and attractiveness. This finding suggests that attractiveness of a product is more closely related to intention to use more than the perceived health risks of that product, or that smokers do not make clear distinctions between product attractiveness and appeal. Survey research suggests that positive expectancies are strongly related to product appeal, but negative expectancies are not30. Additionally, experimental studies have found that anti-smoking advertisements focused on attractiveness (e.g. ‘Smoking is gross!’) increased negative perceptions of smokers among young adolescents31. Various media campaigns have aimed to reduce the appeal of cigarettes by using graphic images that induce disgust32-33.
Perceptions of specific descriptors observed in this study are consistent with previous research. White, which was ranked the least harmful color descriptor in the current study, has been found to be perceived as having lower tar and may be chosen over other colors by smokers concerned about health15. Red and Black color descriptors are perceived as being more harmful20, which was observed in this study. Turquoise was found to be the most appealing color in this study, which is consistent with industry documents suggesting that Blues are the most preferred pack color34. Smooth and Classic are particularly attractive descriptors to smokers26, with Smooth perceived as less harmful and having a smoother taste3,4. Similar results were observed in the current study, in which Smooth was ranked the most attractive and appealing taste descriptor and Classic was ranked the most appealing connotation descriptor. Thus, results of the current study are consistent with extant literature, though the current study is strengthened through the assessment of more brand descriptors than previous studies.
Research and tobacco industry documents indicate that perceptions of descriptors may be influenced by demographic or smoking characteristics of the individual26,35. For instance, we observed sex differences in attractiveness perceptions to the Pink color. Similar sex effects have been observed previously, with women giving more positive responses to a feminine brand name (April) and males giving more positive responses to a masculine brand name (Frontiersman) when smoking identical cigarettes36. Additional demographic factors, such as age, race, education, and nicotine dependence, were found to influence perceptions, though analyses were exploratory and were limited by a lack of a standard correction for multiple comparisons. However, most characteristics only influenced perceptions of individual descriptors (e.g. harm perceptions of Smooth differed by race) and systematic trends were not identified. Though menthol is not a descriptor, race and gender may moderate the association between menthol smoking and harm perceptions of own brand cigarettes37. Future research should be designed specifically to measure differences in brand descriptor perceptions by demographic and other characteristics to determine whether certain descriptors produce misperceptions among smoker sub-groups.
Limitations
Certain study limitations demonstrate the need for continued research on this topic. It is possible that interviewer perceptions could have biased participant rankings, though we attempted to minimize bias by using a standardized discussion guide and encouraging participants to give honest opinions without reflecting on earlier responses and discussion. The current study assessed individual descriptors rather than combinations of descriptors. It is more likely that cigarette companies used multiple descriptors (e.g. color and connotation) to communicate branding rather than single descriptors in isolation. Thus, research on combinations of descriptors, such as in Hoek et al.26, may help understand the interaction effects of descriptors on perceptions and behavior. Additionally, the ranking task included a forced ranking, such that one descriptor had to be labeled most/least harmful, attractive, and appealing. Thus, the difference in perceptions between two descriptors may not be as large as it appears in this study. Another limitation is measurement of perceptions but not actual behavior, though appeal was chosen to measure intention to use. It remains unknown how the perceptions of harm, attractiveness, and appeal in the current study may translate into use and exposure. Future studies may include purchase tasks or measures of consumption to assess how descriptors influence cigarette purchasing and use behaviors, and how these behaviors affect exposure to harmful constituents.
CONCLUSIONS
As they have done in the past, cigarette manufacturers have adapted their branding strategies in response to marketing restrictions including the prohibition on misleading brand descriptors such as ‘light’ and ‘mild’14,16. The current study observed that even after ‘light’ and ‘mild’ brand descriptors were prohibited from cigarette marketing, brand descriptors still influence perceptions of harm and intention to use, potentially as a result of newer brand descriptors and packaging colors3,12,14,26. It is important for the FDA to evaluate all brand descriptors for regulatory action. One consideration should be the use of plain packaging, which may have less appeal to adolescents38 and adult smokers39. Additionally, the FDA should use the lessons learned from cigarette branding when considering regulation of alternative products such as electronic cigarettes and heated tobacco products, novel products that use descriptors to convey information about flavor and other characteristics that can influence perceptions of harm and appeal40.