INTRODUCTION
The rapid rise in non-communicable diseases (NCDs) has increased health expenditures, premature deaths, and preventable morbidity, placing pressure on communities and governments. Approximately 60% of annual deaths globally are attributable to NCDs1, and occur at a disproportionately higher rate in low- and middle-income countries (LMICs)2.
A major modifiable risk-factor for various NCDs is the use of tobacco products, with tobacco directly responsible for more than eight million deaths globally each year3. Tobacco use also places a significant economic burden on countries’ healthcare systems. Goodchild et al.4 estimated that 5.7% of global health expenditure in 2012 was the result of smoking-attributable diseases. Approximately 40% of these costs were borne by LMICS4.
Globally, tobacco consumption has shown a persistent downward trend, largely attributed to increased tobacco control policies such as increased excise taxes, the banning of marketing, better monitoring of tobacco trends and limited smoking in public spaces5. While Asian countries have also experienced a drop in tobacco consumption, the rates remain dangerously high, especially among men. In Africa, tobacco consumption rates remain relatively low among men and women when compared to global trends. However, some authors have argued that most African countries are still in the first phase of the tobacco epidemic, and tobacco consumption is bound to rise if there is no intervention5. There is a long latency period between tobacco consumption and onset of tobacco-related diseases. Models predicting the stages of the cigarette epidemic across countries have assumed a three to four decade delay between peaks of smoking prevalence and the onset of tobacco-related diseases, with different periods of latency depending on the disease6. Therefore, this nature of tobacco-related diseases means that the health consequences of this surge in Africa may only be felt in decades to come7.
Despite this consistent downward trend, there is international evidence that tobacco consumption rates are significantly higher among socioeconomically vulnerable groups compared to wealthier peers. Using country-level data, researchers have often found that smoking is more prevalent among groups living in lower wealth or income households8,9, and among groups with lower levels of education10,11. Higher tobacco consumption will likely result in an increased risk of developing tobacco-related diseases, which will result in larger burdens of healthcare costs. This is worrisome given the globally well-established health gradient, which shows a clear inverse relationship between health and wealth12. Unequal consumption of tobacco consumption across wealth bands will inevitably perpetuate and deepen these existing health inequalities.
This article sets out to measure the wealth-related inequality in tobacco consumption in six LMICs, as well as its contributing factors using decomposition analysis. The LMICs investigated in the analysis include China, Ghana, India, Mexico, the Russian Federation and South Africa.
Using the World Health Organization’s Study on Global Ageing and Adult Health (WHO SAGE) data set for each country (2008–2010), this article focuses on the adult population aged ≥50 years. The focus on the older population group is driven by evidence that smoking behavior is linked to frailty, a precursor to disability, and already more prevalent with increasing age13. While there are a number of studies measuring the inequality in tobacco consumption in high-income countries (HICs), very few exist in LMICs14 and even fewer focusing on the contributing factors15,16. The aim of the research is to estimate the level of wealth-related inequality in tobacco consumption, and decomposing these inequalities in order to gain a deeper understanding of the factors and broader social forces driving these inequalities.
Concentration indices and decomposition approaches are used in the analysis to gauge the full distribution of tobacco consumption in a country, rather than focusing on the lower end of the distribution only as would be the case with univariate statistics and regression analyses. The methodological approach is used as it allows us to gauge why inequalities exist, as opposed to solely understanding what factors contribute to consumption patterns. Firstly, the concentration index makes it possible to establish the extent of wealth-related inequality in tobacco consumption. The decomposition analysis then allows us to assess how the wealth inequality in various factors contribute to these inequalities.
METHODS
WHO SAGE data
Data on the population aged ≥50 years were used from the multi-country WHO SAGE. Data were collected between 2007 and 2010 on six emerging economies, namely China, Ghana, India, Mexico, the Russian Federation and South Africa. Country selection was made by the WHO, and all countries sampled were included in our analysis, with the intent of including a broad range of countries of varying economic status and geographical regions and aging populations with differing demographic and epidemiological characteristics. The datasets contain information on a range of sociodemographic, health and lifestyle variables, including tobacco consumption and is nationally representative of the adult (aged ≥50 years) population17.
The targeted sample of households per country of analysis was 6000 households, with all members of a household invited to participate. The unweighted sample sizes of completed or partially completed interviews are: 13165 (China), 4305 (Ghana), 6578 (India), 2327 (Mexico), 3938 (Russian Federation) and 3840 (South Africa). More information in the sampling methodology is available in the Supplementary file.
Current tobacco consumption variable
The analysis focuses on whether a respondent is currently consuming tobacco. Tobacco use includes the smoking, sniffing, or chewing of any tobacco products, including cigarettes, cigars, pipes, chewing tobacco or snuff. The outcome variable, current tobacco consumption (CTC) is measured as a binary variable equal to one if someone does consume tobacco.
Wealth variable
Wealth is captured using an index based on household assets, dwelling characteristics, and access to basic services such as sanitation and water. The index is subsequently divided into quintiles based on the distribution within a country, with Quintile 1 being the poorest category17.
Independent variables
A range of sociodemographic, health and lifestyle variables are included in the analysis. This includes education (No formal education, Less than primary school, Primary school completed, Secondary school completed, High school or equivalent completed, College/University completed), gender (male or female), marital status, rural/urban residence, and age categories (50–59 years, 60–69 years, 70–79 years, ≥80 years).
An indicator for moderate to severe self-reported sadness or depression is also included in the analysis. This is in keeping with studies that have found a link between tobacco consumption and psychological distress18,19. Respondents were posed the question: ‘Overall in the last 30 days, how much of a problem did you have with feeling sad, low or depressed’. Response options were: none, mild, moderate, severe and extreme. A binary variable is included and set equal to one if respondents report moderate to extreme levels of depression.
We also control for whether a person consumed alcohol in the last 30 days, with a binary variable set equal to one if they did. The inclusion of this variable is to relate the possible relationship between dual use of alcohol and tobacco consumption.
Statistical analysis
The wealth-related inequality in tobacco consumption is measured using concentration indices, and subsequently decomposed to establish the factors contributing to these inequalities. The analysis is performed for each country separately, as well as for each country disaggregated by gender. Tobacco epidemics within countries tend to follow a specific projection. At the start of the epidemic, tobacco consumption increases among men, followed by a delayed increase among women7. This has resulted in different tobacco consumption rates by gender across countries, with men globally consuming more than women. The difference in smoking rates between men and women are more pronounced in LMICs than HICs20.
The concentration index (CI) is used as a tool to quantify the extent of inequality in tobacco consumption over the distribution of wealth in the countries analyzed. The CI ranges between minus one and plus one, with a positive value indicating that tobacco consumption is concentrated among the wealthy. Should the results show a negative concentration index, this would indicate that tobacco consumption is concentrated among the wealth-poor, and value of zero indicates that tobacco consumption is equally distributed across wealth groups in the population21. The absolute size of the concentration index indicates the level of inequality. The standard concentration index CS can be expressed as follows:
where hctc is the outcome for tobacco consumption, μCTC is its mean, and r is the fractional rank of the individual in the wealth distribution ranging from the relative poorest wealth quintile to the relative wealthiest.
The standard concentration index proves problematic when a binary and bounded variable is used, given that it does not result in a concentration index that ranges between -1 and 1. As such, our binary dependent variable ‘current tobacco consumption’ requires some form of normalization22. The Erreygers’ corrected concentration index (CCI) is used in this statistical analysis in order to accommodate this potential shortcoming23. As expressed in Wagstaff’s comment on the Erreygers’ CCI24, the CCI normalizes the general CI as follows:
Where μ is the mean of the current tobacco consumption variable, b is its upper limit, a its minimum, and CS the standard concentration index prior to Erreygers’ correction as expressed in equation (1).
After calculating the CCI for each country and gender, these CCIs are decomposed to determine which sociodemographic, health and lifestyle variable contribute to these inequalities. The decomposition analysis follows the Wagstaff et al.25 methodology. Firstly, the linear relationship between current tobacco consumption for individual i, and its explanatory variables can be expressed as follows:
Where xik is the set of k sociodemographic, health, and lifestyle factors for individual i, the Betas are parameters, and εi is the error term. In this linear model, the decomposition for the Erreygers’ CCI is expressed as follows:
The decomposed Erreygers CCI is the summed product of various components, multiplied by four. In this expression, βkxk is the elasticity of factor xk to changes in CTC, where xk is the mean of xk.
C(xk) is the wealth-related inequality in factor xk, and Cε is the generalized concentration index of the error term. Given that estimating the equation entails estimating the various components, a bootstrapping technique needs to be applied to calculate standard errors for the absolute contribution of a factor to the inequality in tobacco consumption26. Following articles that have adopted a similar methodology, a robust bootstrapping at 500 replications was applied27,28. A generalized linear model (GLM) from the binomial family with a link function is used in the decomposition estimation29.
The results from the decomposition analysis are reported in Table 3 and can be interpreted as follows. Beta indicates the marginal effects from the GLM analysis. The two contribution rows show the absolute and the relative contributions of each explanatory variable to the overall wealth-related inequality in current tobacco consumption.
The analysis was performed on Stata v16.0. (https://doi.org/10.6084/m9.figshare.14561790.v1) Effects are considered statistically significant at a 5% level. The analytical sample was restricted to those with no missing observations. One challenge with recording self-reported tobacco and alcohol consumption behavior is the likelihood of non-reporting or underreporting due to social bias associated with these lifestyle choices. Despite this, the analytical sample response rates remain relatively high at 97% (China), 98% (Ghana), 99% (India), 76% (Mexico), 97% (Russian Federation) and 91% (South Africa). As a robustness check, we also ran the analysis using data from individuals with missing observations, yet the results remain similar and are reported in the Supplementary file Figure S1.
The article relied on secondary analysis of publicly available data from various countries. Ethical approval for the research of human participants as well as their statements of protection were granted by the original data collectors and local ethical review boards in each country.
RESULTS
A summary of the descriptive statistics is provided in Table 1. The table shows high tobacco consumption rates across countries, with the highest observed in India (47%), China, (27%), South Africa (26%), Mexico (19%), Russia (18%) and the lowest in Ghana (13%).
Table 1
Descriptive statistics (%) of the sample analyzed
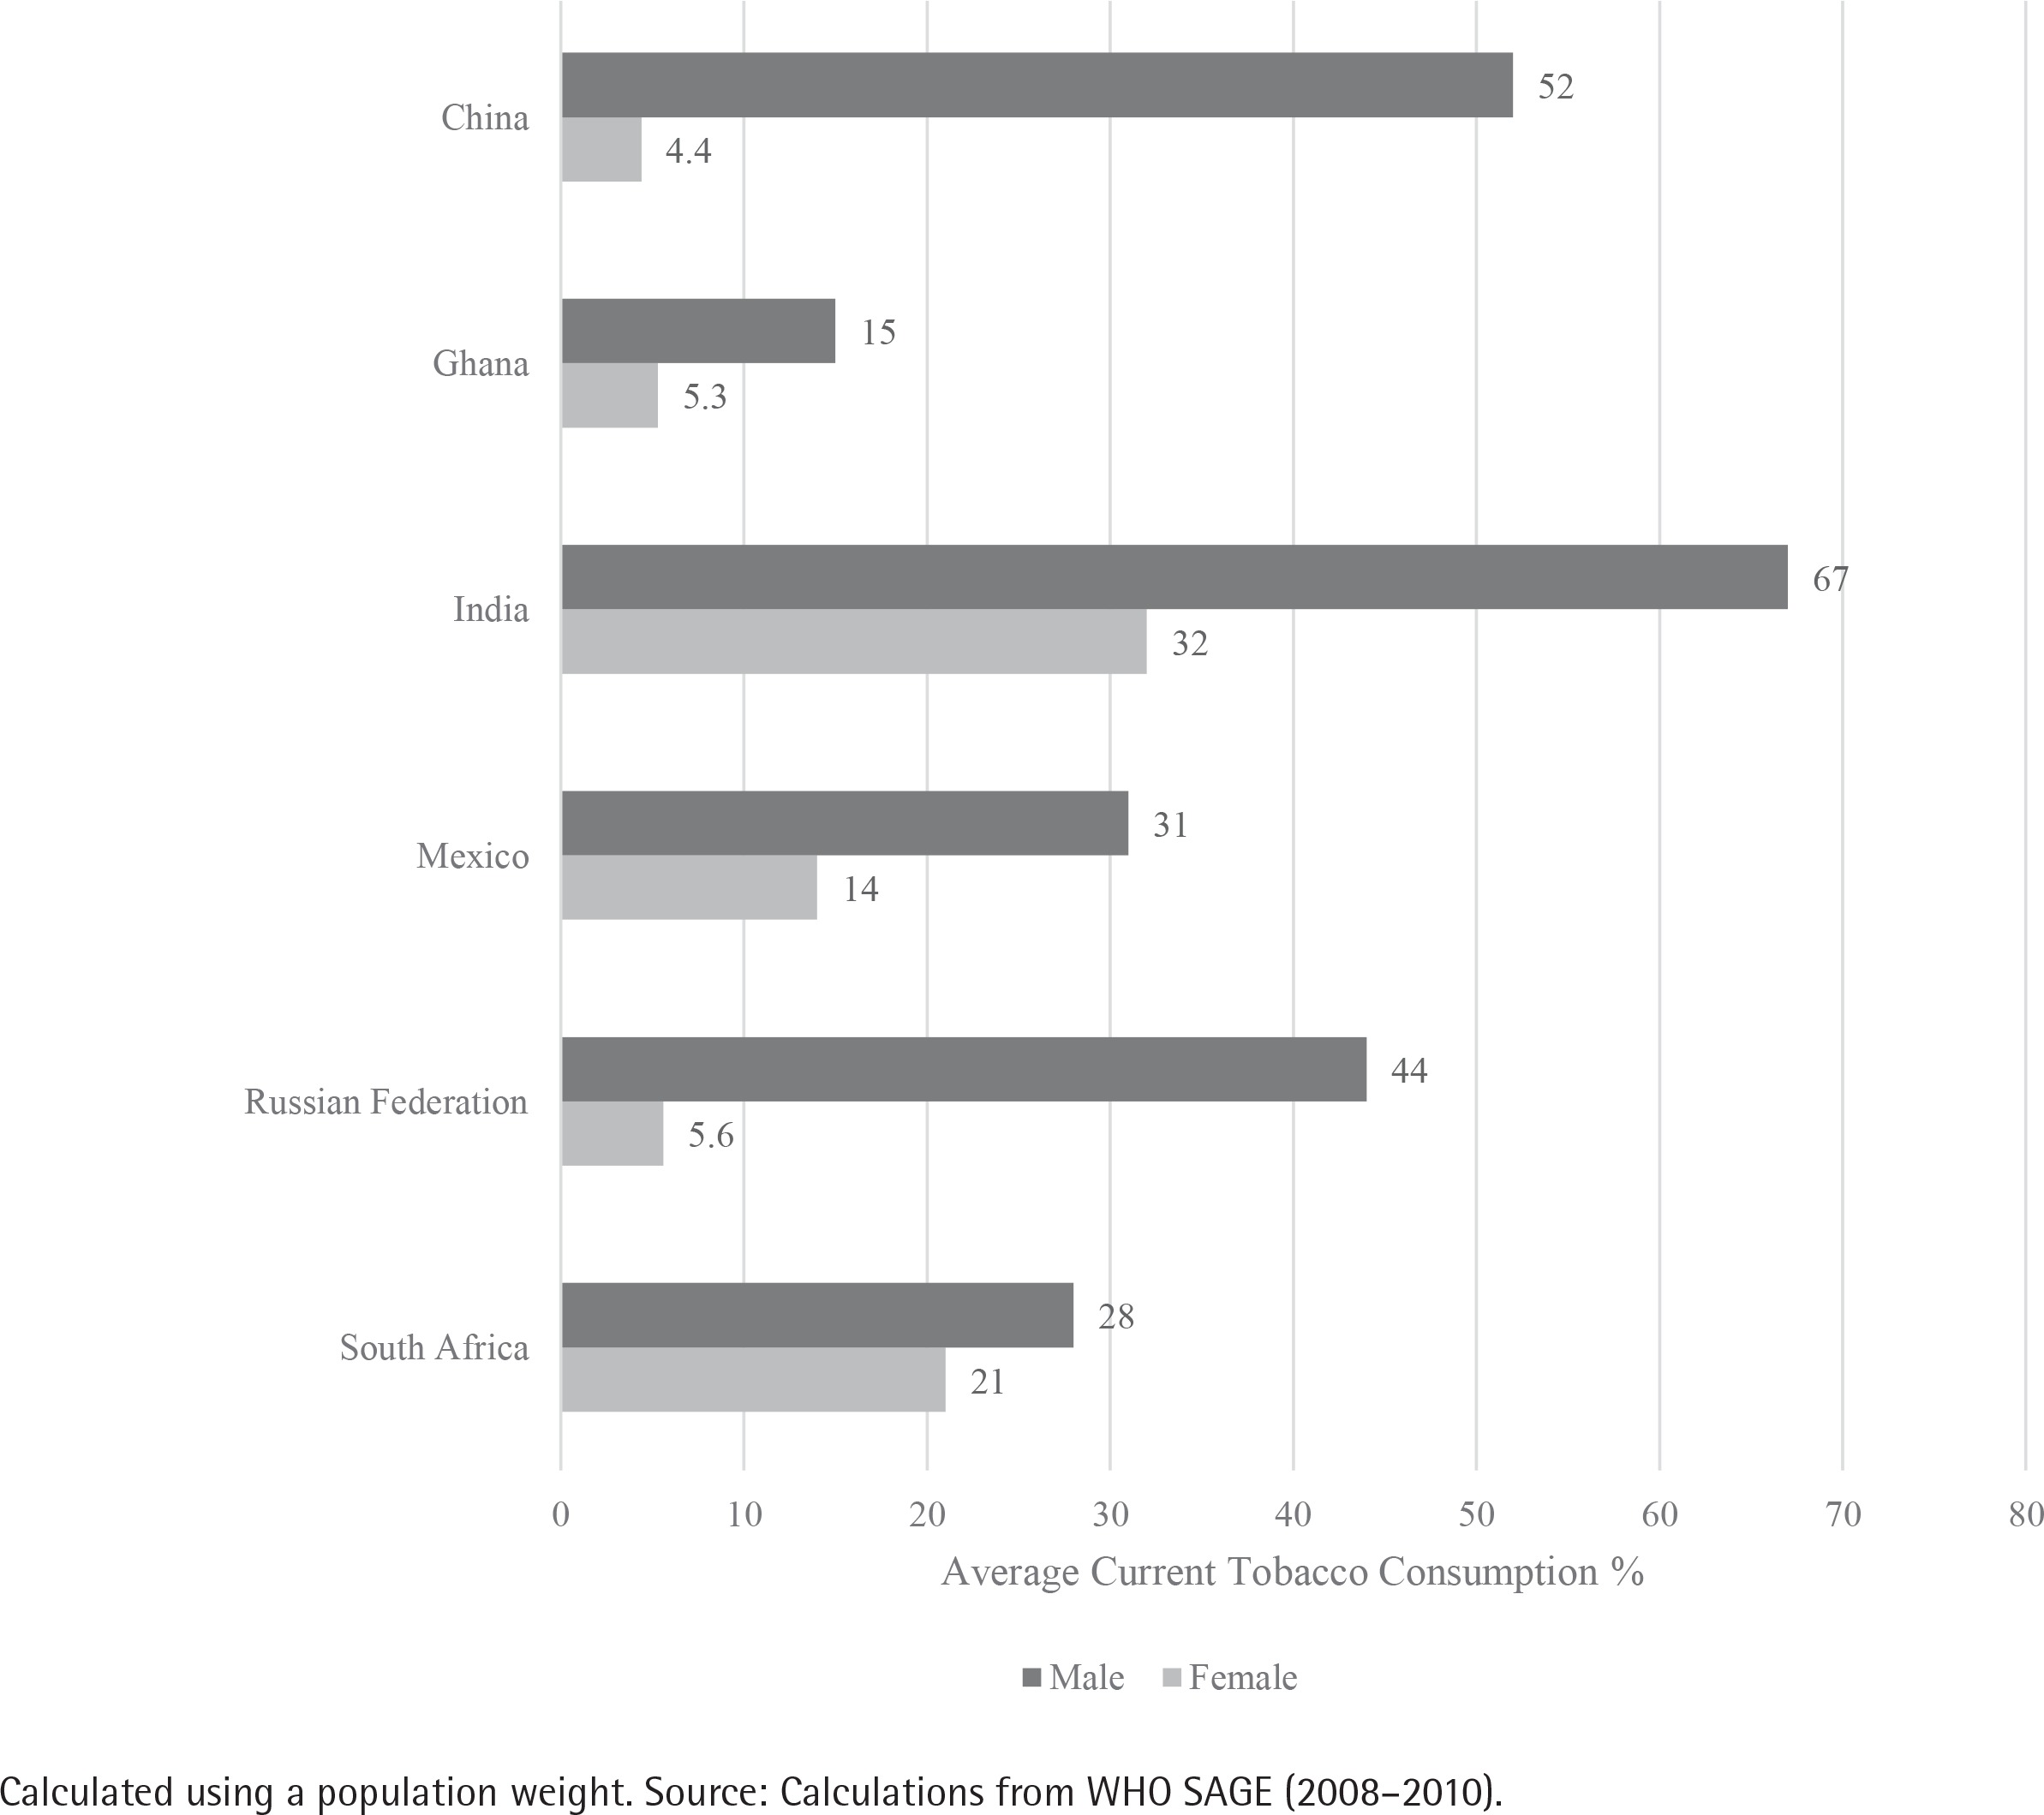
A closer look at current tobacco consumption (Figure 1) disaggregated by gender reveals the stark differences in tobacco consumption across countries analyzed. In China (52%), India (67%) and the Russian Federation (44%), current tobacco consumption among males exceed 40%. While in China (4%), Ghana (5%) and the Russian Federation (6%), current tobacco consumption among females is still below 10%. Only in South Africa do we observe a less than 10 percentage point difference in the tobacco consumption of males (28%) and females (21%).
The concentration indices in Table 2 illustrate heterogenous effects across countries. In China (CCI= -0.062, p=0.000), Ghana (CCI= -0.116, p=0.000), India (CCI= -0.19, p=0.000) and South Africa (CCI= -0.056, p=0.000), CTC is significantly and disproportionately concentrated among the poor. In Mexico (CCI=0.112, p=0.000) and the Russian Federation (CCI=0.059, p=0.000), tobacco consumption is significantly and disproportionately concentrated among the wealthy. These trends persist and deepen when we focus only on the male population. In China, Ghana, India, and South Africa, CTC is disproportionately concentrated among poorer men. While tobacco consumption is disproportionately concentrated among wealthier men in Mexico and the Russian Federation, the CCI loses significance in the Russian Federation. For female tobacco consumers, the negative concentration indices across countries indicate that tobacco consumption is statistically significantly and disproportionately concentrated among the poorer groups, except for Mexico which has a small, positive but insignificant effect. The size of the CCIs for females are much smaller than the CCIs for males, indicating a more equal distribution of current tobacco consumption among females. Given the small size of CCIs for females across countries except India, the analysis will only focus on decomposing the CCIs for the overall population as well as males separately. The full set of decomposition results for statistically significant CCIs for the female population is available in the Supplementary file.
Table 2
Concentration indices for current tobacco consumption, across country and by gender
| China | Ghana | India | Mexico | Russia | South Africa | ||
|---|---|---|---|---|---|---|---|
| All | CCI (Standard error) | -0.062*** (0.009) | -0.116*** (0.011) | -0.187*** (0.014) | 0.112*** (0.022) | 0.059*** (0.015) | -0.056*** (0.016) |
| p-value | 0.000 | 0.000 | 0.000 | 0.000 | 0.0001 | 0.0006 | |
| Males only | CCI (Standard error) | -0.147*** (0.014) | -0.18*** (0.017) | -0.211*** (0.018) | 0.181*** (0.038) | 0.044 (0.031) | -0.09*** (0.026) |
| p-value | 0.000 | 0.000 | 0.000 | 0.000 | 0.1547 | 0.0006 | |
| Females only | CCI (Standard error) | -0.007 (0.006) | -0.069*** (0.011) | -0.186*** (0.018) | 0.021 (0.024) | -0.04*** (0.011) | -0.034* (0.02) |
| p-value | 0.244 | 0.000 | 0.000 | 0.384 | 0.0002 | 0.092 | |
The CCI ranges between minus one and plus one, with a positive value indicating that tobacco consumption is concentrated among the wealthy. Should the results show a negative concentration index, this would indicate that tobacco consumption is concentrated among the wealth-poor, and value of zero indicates that tobacco consumption is equally distributed across wealth groups in the population. Quintile 1 represent the poorest quintile, and quintile 5 the wealthiest. [Source: Calculations from the World Health Organizations Study on Global Ageing and Adult Health (2008-2010)]
The decomposition analysis is only implemented on statistically significant CCIs. The results from the overall decomposition are shown in Table 3.
Table 3
Decomposition of current tobacco consumption for overall populations, per country
| China | Ghana | India | Mexico | Russia | South Africa | ||
|---|---|---|---|---|---|---|---|
| Depressed mood | Beta | 0.0404*** | 0.02 | -0.01 | -0.0491* | -0.0225 | 0.0580*** |
| Contribution | 0.00 | -0.000705*** | 0.00143*** | 0.00 | 0.00121*** | -0.00395** | |
| Contribution % | 0.30 | 0.61 | -0.77 | 0.53 | 2.06 | 7.09 | |
| Had a drink in the last 30 days | Beta | 0.158*** | 0.0985*** | 0.319*** | 0.0958*** | 0.125*** | 0.367*** |
| Contribution | 0.00 | -0.0118*** | -0.00431*** | 0.01 | 0.0276*** | -0.01 | |
| Contribution % | -1.10 | 10.16 | 2.30 | 8.15 | 46.87 | 13.29 | |
| Wealth quintile 1 (vs quintile 5) | Beta | 0.0445*** | 0.107*** | 0.133*** | -0.104*** | 0.0534*** | 0.03 |
| Contribution | -0.0152*** | -0.0465*** | -0.0573*** | 0.0130*** | -0.0186*** | -0.0153*** | |
| Contribution % | 24.67 | 40.04 | 30.63 | 11.66 | -31.55 | 27.37 | |
| Wealth quintile 2 (vs quintile 5) | Beta | 0.0597*** | 0.0611*** | 0.105*** | -0.101*** | 0.00135 | 0.00 |
| Contribution | -0.0149*** | -0.0156*** | -0.0281*** | 0.0505*** | -0.000395*** | -0.00112*** | |
| Contribution % | 24.13 | 13.45 | 15.02 | 45.26 | -0.67 | 2.00 | |
| Wealth quintile 3 (vs quintile 5) | Beta | 0.0246** | 0.0476*** | 0.0705*** | -0.122*** | -0.0180 | 0.0416* |
| Contribution | -0.00203*** | -0.00165*** | -0.00235*** | 0.01 | 0.00104*** | 0.00 | |
| Contribution % | 3.29 | 1.42 | 1.26 | 9.30 | 1.76 | 0.88 | |
| Wealth quintile 4 (vs quintile 5) | Beta | 0.0228** | 0.0294* | 0.0357** | -0.0698*** | -0.0217 | 0.02 |
| Contribution | 0.00600*** | 0.00731*** | 0.00717*** | -0.00787** | -0.00446*** | 0.00436*** | |
| Contribution % | 0.28 | 0.30 | 0.26 | 0.15 | 0.25 | 0.30 | |
| Less than primary school (vs no formal education) | Beta | -0.0189* | -0.0254* | -0.0330* | 0.102 | 0.0537*** | |
| Contribution | 0.00122*** | 0.000236* | 0.00 | -6.51e-05** | -0.00617*** | ||
| Contribution % | -1.97 | -0.20 | 0.04 | -0.11 | 11.06 | ||
| Primary school completed (vs no formal education) | Beta | -0.0533*** | -0.0604*** | -0.0436** | -0.01 | 0.181 | 0.01 |
| Contribution | 0.00 | -0.00123*** | -0.00132*** | 0.00 | -0.00193*** | 0.00 | |
| Contribution % | 0.54 | 1.06 | 0.70 | -0.25 | -3.28 | 0.09 | |
| Secondary school completed (vs no formal education) | Beta | -0.0277** | -0.02 | -0.0908*** | -0.03 | 0.0956 | 0.02 |
| Contribution | -0.00251*** | -0.000359*** | -0.00338*** | -0.00240* | -0.00904*** | 0.00137*** | |
| Contribution % | 4.05 | 0.31 | 1.80 | -2.15 | -15.38 | -2.45 | |
| High school (or equivalent) completed (vs no formal education) | Beta | -0.0733*** | -0.0536*** | -0.109*** | 0.138*** | 0.0443 | -0.0619** |
| Contribution | -0.00583*** | -0.00631*** | -0.00462*** | 0.00 | 0.00 | -0.00396*** | |
| Contribution % | 9.44 | 5.44 | 2.47 | 0.50 | 5.55 | 7.10 | |
| College/university completed (vs no formal education) | Beta | -0.152*** | -0.118*** | -0.258*** | -0.125*** | -0.0450 | 0.01 |
| Contribution | -0.00258*** | -0.00174*** | -0.00652*** | -0.00802** | -0.00499*** | 0.000285*** | |
| Contribution % | 4.18 | 1.50 | 3.48 | -7.19 | -8.48 | -0.51 | |
| Rural (vs urban) locality | Beta | 0.0340*** | 0.0239** | 0.0672*** | -0.173*** | 0.00218 | 0.00 |
| Contribution | -0.0288*** | -0.0253*** | -0.0450*** | 0.0233* | 0.00 | -0.00203*** | |
| Contribution % | 46.54 | 21.76 | 24.03 | 20.88 | 0.40 | 3.63 | |
| Female (vs male) | Beta | -0.388*** | -0.107*** | -0.358*** | -0.182*** | -0.270*** | -0.02 |
| Contribution | 0.0294*** | 0.0252*** | 0.02 | 0.02 | 0.108*** | 0.00303* | |
| Contribution % | -47.56 | -21.73 | -12.06 | 13.85 | 183.23 | -5.42 | |
| Married (vs non-married) | Beta | -0.0532*** | -0.01 | -0.0534*** | -0.106*** | -0.0372*** | 0.00 |
| Contribution | -0.0256*** | -0.00300*** | -0.0168*** | -0.0767*** | -0.0246*** | -0.00200*** | |
| Contribution % | 41.51 | 2.59 | 8.97 | -68.72 | -41.90 | 3.59 | |
| Age (years) (Ref. 50–59 years) | |||||||
| 60–69 | Beta | -0.0429*** | 0.00 | 0.01 | 0.03 | -0.0785*** | -0.02 |
| Contribution | 0.00224*** | 0.00 | 0.00 | 0.00 | 0.00 | 0.00 | |
| Contribution % | -3.62 | 0.02 | 0.17 | 0.50 | 0.35 | 0.86 | |
| 70–79 | Beta | -0.0730*** | 0.01 | -0.02 | -0.0640** | -0.200*** | -0.03 |
| Contribution | 0.00506*** | -0.000236** | 0.00 | 0.00518** | 0.0267*** | -0.00121*** | |
| Contribution % | -8.18 | 0.20 | -0.12 | 4.65 | 45.46 | 2.16 | |
| ≥80 | Beta | -0.121*** | -0.02 | -0.0563** | -0.0799* | -0.312*** | 0.02 |
| Contribution | 0.000799*** | 0.000174** | 0.00 | 0.000839** | 0.00796*** | 0.00 | |
| Contribution % | -1.29 | -0.15 | -0.02 | 0.75 | 13.52 | 0.17 | |
| Observations, n | 12763 | 4227 | 6535 | 1763 | 3643 | 3497 | |
Each country had unique trends and are therefore discussed separately. In China, rural location (47%), being female (-39%) and being married (42%) are the largest and significant contributors to wealth-related inequality in CTC in China. The betas on these variables indicate that rural residence is positively associated with CTC compared to urban residence, while being female or being married are negatively associated. Differences in gendered tobacco consumption rates result in significant wealth-related inequalities in CTC. The positive absolute contribution on the female variable indicates that decreasing tobacco consumption among men would result in a narrowing of the wealth-related gap in CTC.
In Ghana, being in wealth quintile 1 (40%), being female (-22%), and living in a rural locality (22%) are the largest contributors to wealth-related inequality. A similar trend is observed in India, except that being in wealth quintile 2 (15%) is also a significant and large contributor to wealth-related inequality in CTC.
A different trend emerges in South Africa. Although wealth status is the largest contributor to inequality, the other largest contributors are whether someone consumed alcohol in the last 30 days (13%, but p>0.1) and whether they had less than primary level education compared to no schooling (11%). While education is not a significant or large contributor across countries, lower education contributes to widening the gap in CTC in South Africa. Another evident trend is the role of moderate depression on wealth-related inequalities in CTC. Moderate depression is positively associated with current tobacco consumption, and a significant contributor to wealth-related inequality (7%).
The large and significant contribution of being female is evident in China, Ghana, India, and South Africa, where CTC is disproportionately concentrated among the poor, albeit insignificantly in India. Being female significantly contributes to closing the gap in wealth-related inequalities in CTC. While the variable is insignificant in Mexico, being female has a pro-rich impact on wealth-related inequalities in CTC in the Russian Federation, implying that being female contributed to worsening the burden on the rich in Russian Federation.
In Mexico, marital status (being married contributes -69%), wealth status (being in wealth quintiles 1 contributes 12% and wealth quintile 2 contributes 46%), and rural locality (21%) are the main drivers of inequality in CTC. In the Russian Federation, gender (being female contributes 183%), whether somebody consumed alcohol in the last 30 days (47%), and age (being in age groups 70–79 and ≥80 years, jointly contribute 59%) all contribute to the wealth-related inequalities in CTC.
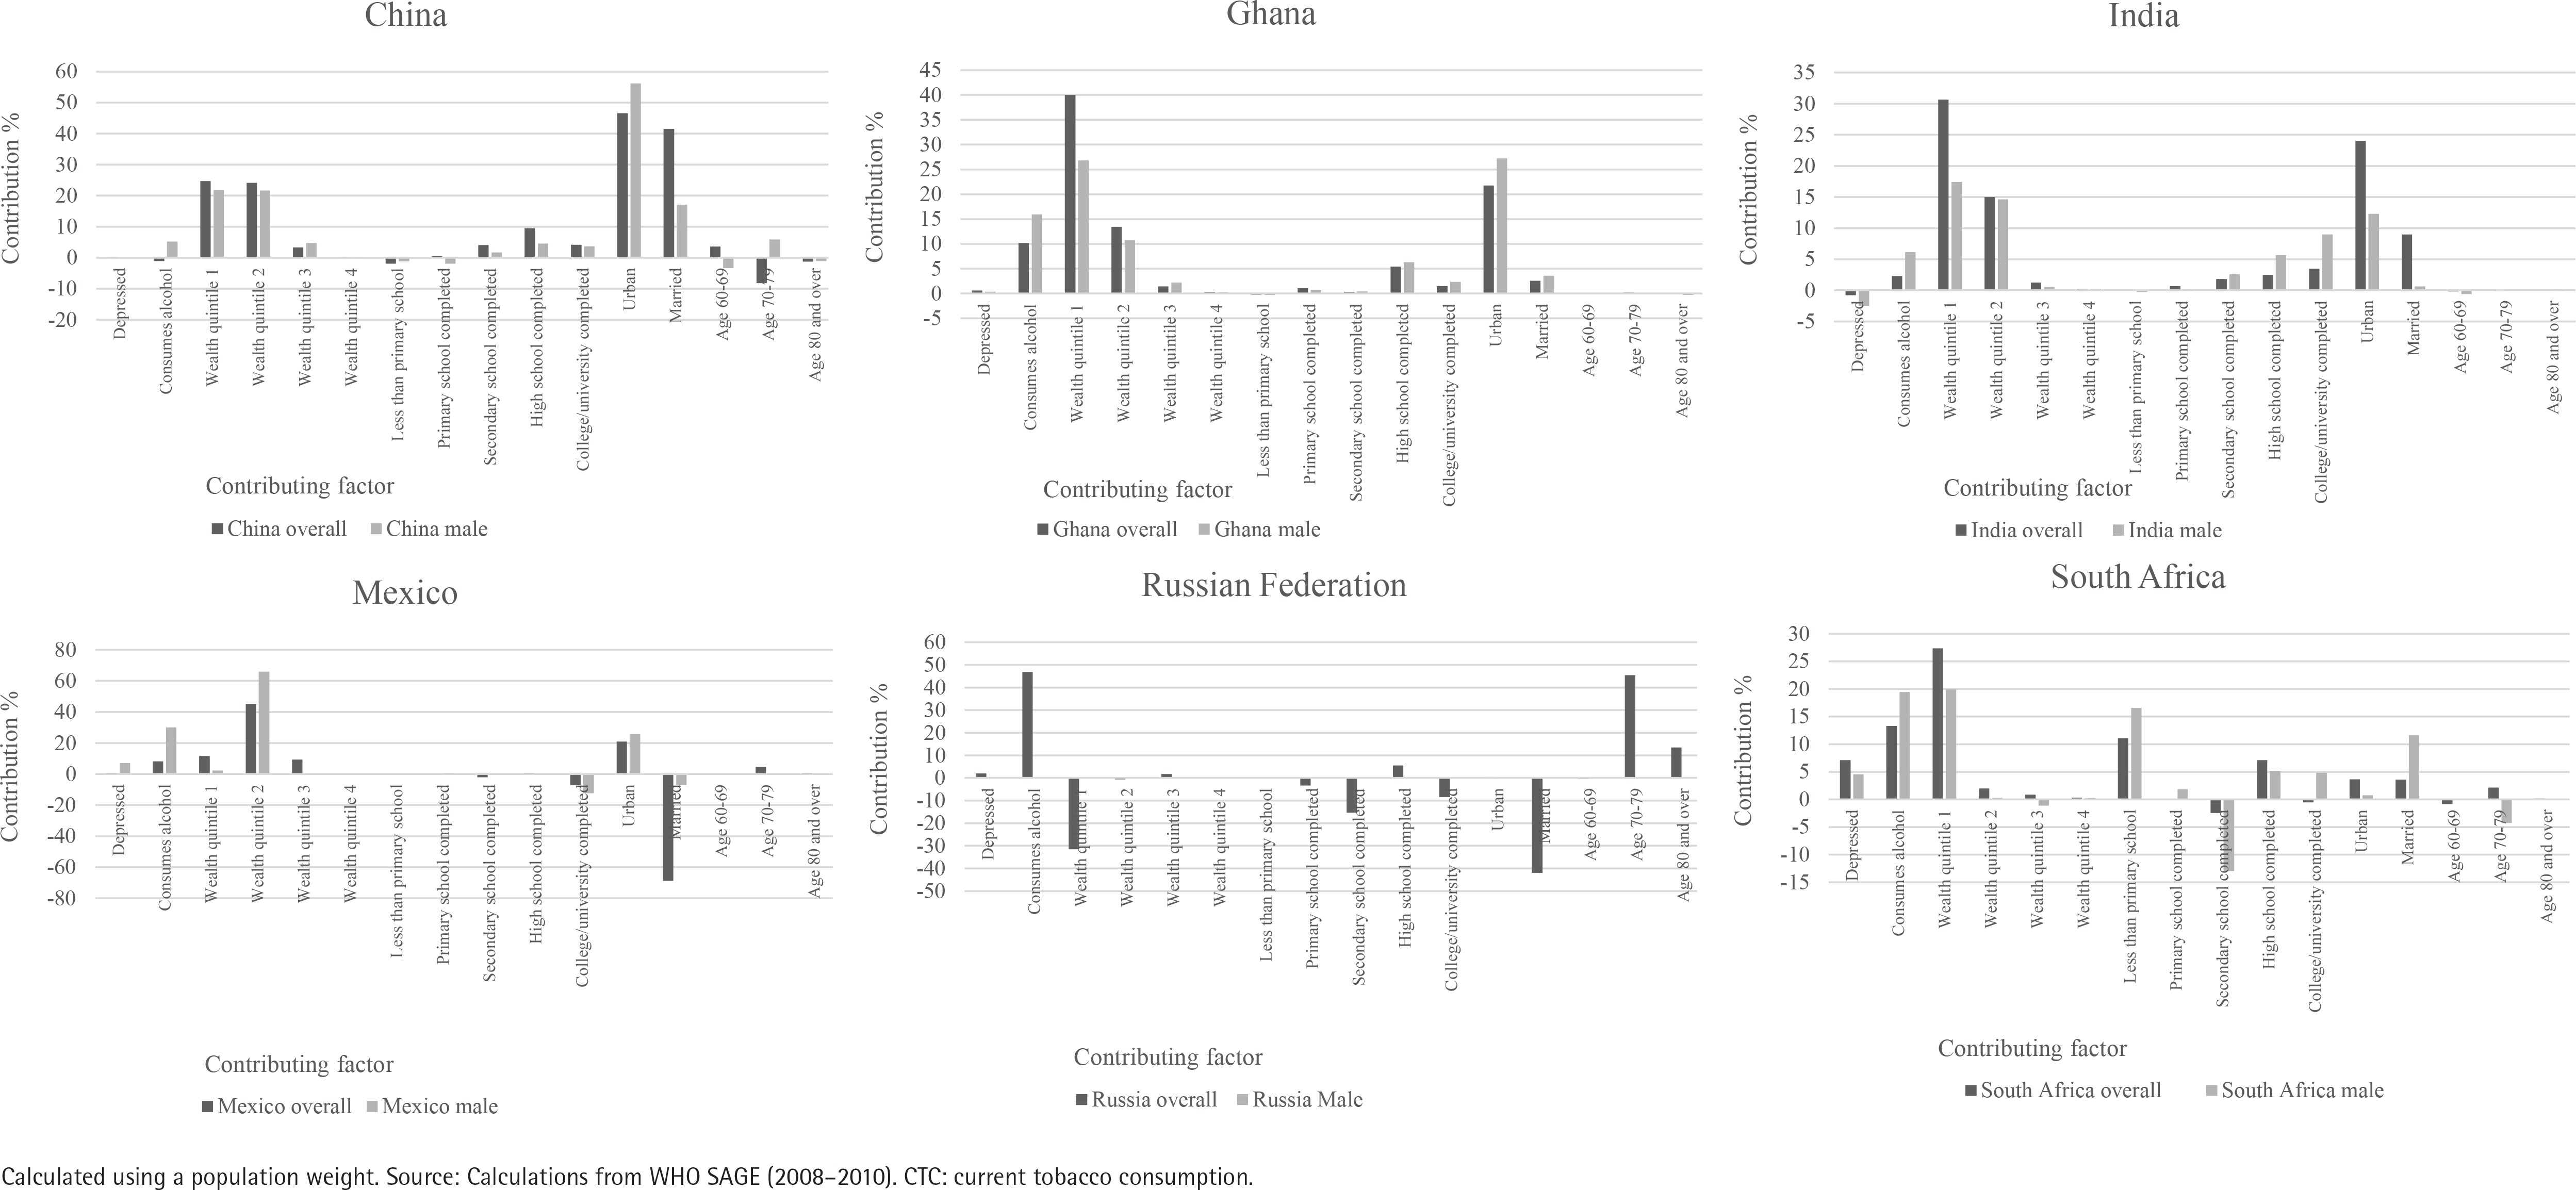
The full decomposition results are available in the Supplementary file, but in the interest of space we plot the Contribution % of the overall and the male populations for each country in Figure 2. The Russian Federation male population is not included in the comparison due to the statistical insignificance of its CCI. According to Figure 2, important contributors to wealth-related CTC inequality are similar when the focus is narrowed from the overall population to the male population. There are a few exceptions. For instance, where marriage was a significant and large contributor to inequality in the overall Mexican population, the contribution becomes negligent but still significant when the focus narrows only to the male population.
DISCUSSION
Differences in lifestyle choices, such as smoking, alcohol consumption or a sedentary lifestyle, can play a key role in perpetuating existing health inequalities. The article sets out to measure the level of inequality in one of these lifestyle choices, namely current tobacco consumption. The analysis focuses specifically on the populations aged ≥50 years, a group which already experiences increasing health challenges. The focus on prevention and cessation in this age group is key to curbing rising healthcare costs and ensuring longevity.
Despite a large body of knowledge on tobacco consumption patterns in HICs, there remains a paucity in the knowledge of these factors in LMICs, particularly when it comes to comparing LMICs globally. Authors Parascandola and Bloch30 argue that expanding tobacco control research in LMICs is crucial given that tobacco consumers are now largely concentrated in these countries and rates are expected to rise. The findings from the overwhelming amount of research in HICs may not always be applicable to LMICs where the social, cultural, and economic environment is different. For instance, while the tobacco prevalence has been found to be concentrated among the socioeconomically disadvantaged in HICs, our results show that this is not always the case in LMICs or at least not when focusing on the adult population aged ≥50 years. LMIC specific findings may be key in shaping country-specific policies.
Berg et al.31, in a recent review article on the status of tobacco control research, highlighted the need to understand health risk behaviors, such as tobacco consumption, to advance our knowledge of mechanisms and risk factors. Furthermore, country-specific estimates are necessary to inform communities as tobacco product markets aim to expand. The importance of understanding and addressing the equity dimensions of tobacco is also highlighted by Hosseinpoor et al.8, who point out that equity concerns are important as both a political and public health priority and how there is little evidence of these inequities in LMICs.
The results show that the levels of inequality in CTC revealed heterogenous effects across countries. While CTC is concentrated among the poor in China, Ghana, India and South Africa, the opposite is true for Russian Federation and Mexico. One theory to explain differences in pro-rich versus pro-poor inequalities in tobacco consumption in middle-income countries is the counter-directional effects of rising incomes and rising health costs as a country’s national income rises. Pampel32 posits that at a low national level of income, tobacco consumption is low among the poor as there are affordability concerns. As a country’s national income rises, tobacco becomes more affordable. However, as national income rises, so does life expectancy and the probability of dying from a preventable disease decrease. Therefore, the marginal health cost of tobacco consumption to the individual rises with income levels. Counter to the affordability effect, the health cost effect pushes down tobacco consumption32. Therefore, whether tobacco consumption is concentrated among the poor or the rich in a middle-income country depends on whether the affordability effect or the health cost effect is dominant. However, Pampel32 further theorizes and proves that both economic and gender inequality may limit the effect of rising national income, by hindering the distribution of higher incomes and purchasing power to lower-income groups.
In the countries studied, the 2010 Gross Domestic Product per capita measured in constant 2010 US Dollar prices are $4550 (China), $1299 (Ghana), $1358 (India), $9271 (Mexico), $10675 (Russian Federation) and $7329 (South Africa) in the countries of analysis33. Given these levels of national income and according to Pampel’s national income theory, we should observe negative CCIs in countries where cigarettes have become affordable or national incomes are higher (Mexico and Russian Federation), yet we observe the opposite. One potential reason could be high levels of inequality which, as Pampel posits, results in a concentration of wealth among higher income groups and a hampering of the income effects to the low wealth groups. Mexico and South Africa have some of the highest levels of inequality globally, according to their Gini indices.
Another possibility is that countries have not yet experienced an increase in health costs. The benefits of rising income levels could be countered by inefficient public healthcare systems and communicable burdens of disease which slow down the rise of life expectancy. Finally, country-specific tobacco control policies32, cultural practices and the differing perceptions of the health consequences of tobacco consumption may also have an impact on differences in tobacco consumption patterns34. While our micro-level analysis did not focus on these macro-economic trends as posited by Pampel32, the findings of both pro-rich and pro-poor wealth-related tobacco inequalities in LMICs echo similar results from Hosseinpoor et al.8 and Chisha et al.16.
The stark differences in CTC between males and females across countries necessitates that a gender-disaggregated analysis also be done. The trends in inequality persist and deepen when we focus only on the male population. Conversely, the inequalities become much smaller and often lose significance when the focus is only on the female population.
While tobacco consumption, and specifically smoking, is globally lower among women, they are projected to rise20. Tobacco consumption rates have traditionally been found to be lower among women due to social disapproval. Hitchman and Fong20 show that the gap between male and female smoking rates are significantly smaller in countries with strong gender empowerment. Tobacco industry marketing have also specifically targeted the marketing of tobacco to women as a symbol of empowerment and emancipation20. It is crucial to stop the long-term progress in women’s empowerment from translating into an increase in tobacco consumption among women. Despite the well-recognized fact that females should be targeted, gender as a subgroup is still not introduced adequately in tobacco control research or policy. An article published by Amos et al.35 emphasizes how tobacco control has remained largely gender blind and the missed opportunities for knowledge generation on women’s tobacco use. This lack of research and effectiveness of tobacco control policies on women and girls was also highlighted in McLellan and Kaufman36. Many opportunities for knowledge generation and effective responses to women’s tobacco use remain lost or overlooked.
A decomposition of the inequalities shows different and unique results for the countries analyzed. Across several countries (China, Ghana, India, and South Africa), we see that gendered differences in tobacco consumption rates are a significant driver of wealth-related inequalities in CTC. Decreasing tobacco consumption among men would result in a closing of the wealth-related gap in CTC. In addition to wealth, another major driver includes rural locality in China, Ghana, India, and Mexico. Living in a rural, rather than an urban locality, deepens the wealth-related inequality in CTC. Marital status is also a key driver of inequality in Mexico and China. Similar results have been found for Namibia16. Age only has a large and statistically significant impact on CTC inequalities in the Russian Federation, where increasing age contributes significantly to tobacco consumption being concentrated among the affluent.
Alongside wealth and education in South Africa, there is evidence of potential psychosocial effects contributing to wealth-related gaps in CTC. Moderate depression is positively associated with current tobacco consumption, and significant contributor to its wealth-related inequality. Alcohol consumption in the last 30 days is also a major contributor, implicating the presence of dual use in driving CTC inequalities. The potential role of dual tobacco and alcohol use in driving wealth-related CTC inequalities is also present in the Russian Federation.
The findings on the potential of psychosocial factors, such as mild depression or alcohol consumption, as contributing to deepening CTC inequalities suggest that a holistic supportive and enabling environment is necessary to support cessation attempts. The findings also point to potentially deep-rooted factors which may be driving poor lifestyle decisions.
Limitations
The study is not without its limitations. Firstly, it uses secondary data collected by the WHO. This limits the study to generating and testing hypotheses, rather than drawing major conclusions. Secondly, the cross-sectional nature of the data results in correlation rather than causal findings. Finally, it is possible that self-reported tobacco consumption is underreported given the social disapproval of the activity, especially among women20.
CONCLUSIONS
Inequalities in current tobacco consumption by wealth status in various LMICs threaten to perpetuate existing health and wealth-related inequalities. The study contributes to the limited literature on socioeconomic related inequality in tobacco consumption8,14, but goes even further by decomposing the inequalities and establishing contributing factors that could prove useful in shaping policies that could decrease inequalities in tobacco consumption.