INTRODUCTION
Primary care (PC) physicians and nurses are in an excellent position to help reduce smoking rates through counselling, which has proved to be an efficient and viable strategy. For the general public, which includes an elevated number of smokers, PC staff represent their first medical contact. These professionals are aware of the medical history and social context of their patients who both trust and consider them models to imitate1,2.
It has been demonstrated that brief counselling alone only results in a 3% rate of smoking cessation. In contrast, the recommended strategy of 5As counselling (Ask about smoking status, Advise the individual to give up, Assess willingness, Assist and Arrange follow-up) together with pharmacologic therapy can triple the result3-6.
In order to standardize and rationalize this kind of assistance, some guidelines recommend the use of stages-of-change. A strategy that provides a practical framework with which to classify smokers and predict abstinence at one year7.
A recent review of the main PC clinical practice guidelines placed emphasis on identifying smokers, registering their consumption, assessing how motivated they were to give up, offering behavioral and pharmacologic therapy, and evaluating abstinence following treatment. It also recommended specific training to offer such assistance8.
Various meta-analyses and reviews have established that in PC, multi-component interventions that combine behavioral support with pharmacologic treatment are the most effective in the 5As strategy9,10. Our group has reported a smoking prevalence in Spain among PC physicians and nurses of 11.8% and 12.8%, respectively11.
The main objective of this study was to analyze the activities carried out by PC physicians and nurses in Spain with respect to smoking cessation management. It included evaluating their training, knowledge, and behavior regarding the issue.
METHODS
Design and scope
A multi-center, transversal study was carried out between June 2016 and March 2017. The study population comprised medical and non-medical staff from the PC teams of the Spanish National Health Service.
Sample size
The sample size (n=3994) was based on 5% simple random sampling of the PC centers belonging to each autonomous community with an estimated 20% dropout rate.
Recruitment
Members of the Smoking Cessation Group (GAT) and the Spanish Family and Community Medical Society (semFYC) created a questionnaire and carried out an ad hoc pilot test. The final version of the questionnaire was designed to be anonymously self-completed online. It described the study objectives and gave the recipient one month for completion. In order to improve participation, telephone calls and emails were employed. Prior to participation, subjects were informed of the study’s objective and that taking part was both voluntary and anonymous.
Variables
Information was gathered regarding sociodemographic data, PC center location (rural/urban), profession (physician, nurse, office staff etc.), years of employment, and labor status. In addition, details were collected regarding tobacco consumption (habitual/occasional smoker, ex-smoker, never smoker), smoking cessation interventions performed at the PC center, administration of diagnostic and therapeutic measures (use of medication, psychosocial intervention strategies), and training/knowledge regarding the management of smoking.
Opinions were evaluated using Likert scales (1 being the least favorable and 5 the most). The statistical analysis was based on agreement of values ≥4.
A complex variable was created – Good Practice (GOLD) with two categories (Good Practice [GP] and Improvable Practice). ‘Always’ (score 5) and ‘Almost Always’ (score 4) were considered GP when the PC physician or nurse asked the patients about their smoking habits and consumption, registered this information in their medical record, recommended giving up, advised patients about illnesses related to smoking, asked them if they had smoking-related questions, explained ways to quit if they wanted to, and agreed on a cessation plan if the patient was willing. A rating of ≤3 was considered Improvable Practice.
Although not part of this study, we also inquired about attitudes with respect to smoking and opinions concerning regulations, smoke-free areas and how smokers were affected, and e-cigarette legislation11.
Data analysis
A descriptive analysis was performed (frequencies and percentages of qualitative variables) and a summary one with respect to quantitative variables (means and standard deviations) with a 95% confidence interval (CI) for both the global sample and study groups. A bivariant analysis was carried out with proportional and mean comparison tests employing non-parametric tests if necessary.
In order to identify variables associated with GP in smoking cessation management, the percentages of any variable that could be explicative was calculated by Pearson chi-squared test. A multi-variant logistic regression model was adjusted. It included significant bi-variables and those considered relevant: sex, age group, location of center, type of contract, years of employment, tobacco consumption, training, and knowledge. Raw (OR) and adjusted odds ratios (AOR) were calculated together with their 95% CI. Level of significance was p≤0.05. The SPSS version 17.0 was employed.
RESULTS
A total of 3965 questionnaires were sent and 2040 (51.5%) responses obtained, 1514 from PC physicians and nurses, the rest of the sample (516) was basically administrative support personnel, of no interest for this topic. With respect to the first group, the average age was 50.5 years, somewhat higher in physicians than nurses (51.2 and 49.7 years, respectively). Women represented 75.8%; 72% worked in urban areas, and the number of years employed was 18.3 (20.4 and 16.1 for physicians and nurses, respectively). Most of them had permanent contracts. Almost half the respondents were non-smokers (49.7%), 38.1% ex-smokers, and 12.2% smokers (daily/occasional) with differences between physicians (11.2%) and nurses (13.2%). Slightly more than half (51.4%) believed they had enough knowledge to help their patients quit smoking although there were differences between physicians (54.9%) and nurses (47.5%). Only 41.5% had received specific training (Table 1).
Table 1
Sociodemographic characteristics, smoking prevalence, and level of training and knowledge among primary care physicians and nurses (N=1514)
| Variables | Total* n (%) | Physician n (%) | Nurse n (%) | p |
|---|---|---|---|---|
| Participants*a | 1514 (100) | 792 (52.3) | 722 (47.7) | |
| Age (years), (mean±SD) | 50.51±9.8 | 51.2±9.6 | 49.74±9.8 | 0.004 |
| Sex, n (%) | ||||
| Male | 367 (24.2) | 260 (32.8) | 107 (14.8) | |
| Female | 1147 (75.8) | 532 (67.2) | 615 (85.2) | 0.001 |
| Center, n (%) | ||||
| Urban | 1090 (72.0) | 567 (71.3) | 523 (72.4) | |
| Rural | 424 (28.0) | 225 (28.7) | 199 (27.6) | 0.379 |
| Years of employment, (mean±SD) Employment status, n (%) | 18.39±10.0 | 20.46±9.76 | 16.10±9.90 | 0.001 |
| Permanent | 1271 (83.9) | 681 (86.0) | 590 (81.7) | 0.025 |
| Interim | 243 (16.1) | 111 (14.0) | 132 (18.3) | |
| Smoking status, n (%) | ||||
| Non-smoker | 753 (49.7) | 428 (54.0) | 325 (45.0) | |
| Ex-smoker | 577 (38.1) | 275 (34.7) | 302 (41.8) | 0.002 |
| Smoker | 184 (12.2) | 89 (11.2) | 95 (13.2) | |
| Sufficient knowledge, n (%) | ||||
| Yes | 778 (51.4) | 435 (54.9) | 343 (47.5) | 0.002 |
| No | 736 (48.6) | 357 (45.1) | 379 (52.5) | |
| Sufficient training, n (%) | ||||
| Yes | 629 (41.5) | 343 (43.3) | 286 (39.6) | 0.08 |
| No | 885 (58.5) | 449 (56.7) | 436 (60.4) | |
Tables 2 and 3 show data concerning practice in smoking cessation attention. They are analyzed according to profession, tobacco consumption, and level of knowledge and training. The most frequent activities were Advise, Ask, and Assist, whilst the least frequent was Arrange (follow-up).
Table 2
Care practice for smokers according to profession and smoking status
Table 3
Care practice for smokers according to level of knowledge and training
We observed differences between nursing and medical staff with respect to registry, explanation of methods, and follow-up agreement. Smokers from both groups gave less advice to their patients about cessation (p=0.001) and agreed on fewer plans to quit (p<0.001). Subjects who claimed to have sufficient knowledge and skills to help patients give up carried out better practice in relation to smoking management in all the variables compared to those who did not (p<0.005). The same occurred with those who had received specific training in smoking cessation (p<0.001).
Psychological therapy was the most common intervention (35.3%) whilst medication was prescribed by 31.5% (varenicline 19.4%, nicotine replacement therapy 15.7%, and bupropion 7.2%).
Lack of time was the major barrier followed by problems of organization. In addition, one third of the participants considered insufficient training to be an issue (Table 4).
Table 4
The main barriers perceived in primary care regarding smoking cessation management
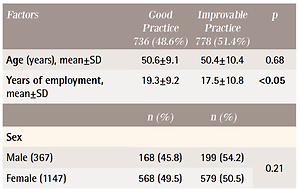
Table 5 depicts the relationship between the complex variable GP (GOLD) and the other variables. GP was carried out by 48.6% of the participants and was associated with: years of employment (>10 years), age (between 45–55 years), being a non-smoker, having an interim contract, and sufficient levels of knowledge and training.
Table 5
Factors associated with Good Practice (GOLD) in care for smokers (bivariant analysis) (N=1514)
The logistic regression analysis (Table 6) depicts the association of GP with the following: interim contract, sufficient knowledge and training, female sex, smoking status, and >10 years employment.
Table 6
Variables related to Good Practice (univariate and multivariate logistic regression analysis)
DISCUSSION
We present here the results from a Spanish population study composed of a representative sample of PC physicians and nurses. With respect to the care of smokers, GP was observed in only 48.6% and corresponded to being a non-smoker and having a high level of knowledge and training, and, to a lesser extent, being female, an ex-smoker, and with a work experience >10 years. The main barriers for GP were lack of time and problems of organization; only 35.4% of the participants mentioned insufficient training as a barrier.
Comparison with other studies
The minor difference between physicians and nurses with respect to GP (49.7% vs 47.4%) could be partially explained by the latter’s greater consumption of tobacco (13.2%). A finding that concurs with another study performed in Spain12, and also one in Bosnia with a markedly greater prevalence of smoking in nurses13. Such results have been confirmed by a systematic review carried out in 201714. Moreover, a number of qualitative studies have reported the effect on GP of negative sensations of guilt and discomfort associated with being a smoker15,16.
A study performed in Switzerland reported a GP level of 85%. Nevertheless, it employed different variables and the percentage of smokers was greater, thus it is not strictly comparable. It did coincide, however, in that good training was related to better practice17. Regarding 5As strategy, research in Italy with 722 PC physicians (13.4% smokers) found similar results – 83.4% and 93.7% for Ask and Advise, respectively18.
In contrast to our findings, a review in 201619 described considerable discrepancies among the different elements that make up GP with regard to PC physicians. From the 35 articles that were included, the following was observed: 65% Ask, 63% Advise, 36% Assess, 44% Asist, and only 22% Arrange (follow-up).
In a study performed in Argentina with 254 physicians it was observed that 90% asked about tobacco consumption and 44% prescribed pharmacologic treatment, both practices related to the training received (OR=6.5; 95% CI: 2.2–19.1)20. A finding that was also evaluated among 456 PC professionals in Jordan, which showed that 51.4% asked about smoking and 50.5% advised cessation. Nevertheless, only 23.7% evaluated willingness to give up smoking, and a mere 17.9% explained different counselling options21.
Differences according to gender
A 2018 study performed in Greece with physicians (25% smokers) found a relationship between female gender and better application of the 5As recommendations (OR=3.38; 95% CI: 1.11–10.35), which coincides with our results (OR=1.3; 95% CI: 1.03–1.7)22. It also reported that expert referrals were more common (46%) in the case of female professionals23.
Differences between smokers and non-smokers
A meta-analysis carried out by Duaso et al.24 observed that physicians who smoked had a 17% greater risk of not recommending their patients to give up smoking (RR=0.83; 95% CI: 0.77–0.90), and remission in cessation programmes was more probable (RR=1.40; 95% CI: 1.09–1.79)24.
An international study in 2009 composed of 2836 PC physicians from 16 countries reported a better GP profile among non-smokers: they asked patients more frequently about their smoking habits (85.0% vs 80.3%), carried out a better registration of consumption (70.0% vs 64.0%), gave more advice (89.9% vs 84.4%), agreed on more follow-up (48.5% vs 39.8%), and prescribed more medication for smoking cessation (30.6% vs 23.3%)25. All of which concur with our results.
Barriers to assistance
According to our data, PC physicians and nurses consider the greatest barriers to be lack of time, problems of organization, and scarcity of resources, and, to a lesser extent, insufficient training. With respect to our environment, in 2005 we had already reported lack of time, low patient motivation, and the need for specific training26. In 2016, in Argentina20 lack of time and training were also described as the main barriers. Some authors21 additionally mentioned scarcity of resources and insufficient institutional support, data that were confirmed in Holland where different medical specialities are included in smoking cessation programmes27.
Training for healthcare workers
The relationship between skills and GP has been widely covered in the literature and in varying environments13,18,23,26. A 2012 Cochrane review28 demonstrated that the training of PC personnel could enhance continued (OR=1.6; 95% CI: 1.26–2.03) and sporadic abstinence (OR=1.36; 95% CI: 1.2– 1.55), and frequency of questions about the date of cessation. It could also lead to more advice and self-help material being offered, and assist in establishing a cessation date.
Other considerations
A 2019 study based on the Eurobarometer29 reported that between 2012 and 2017 the number of individuals who attempted to cease smoking without any help increased (70.3% vs 74.8%) whilst the use of pharmacotherapy and cessation services decreased (14.6% vs 11.1% and 7.5% vs 5.0%, respectively). In addition, it found that those who resided in countries with integral cessation policies had a greater probability of employing pharmacotherapy (OR=1.78; 95% CI: 1.15–2.76) and smoking cessation services (OR=3.44; 95% CI: 1.78–6.66) compared to countries with weak policies (OR=2.27; 95% CI: 1.27–4.06). It should be remembered that from 1 January 2020, the Spanish Healthcare system has financed two smoking cessation drugs, which represents a milestone in achieving better results in the general population.
Limitations and strengths
Our study analyzes certain characteristics of PC physicians and nurses that influence GP in smoking cessation management. Nevertheless, in addition to such issues as standardizing clinical registers and/or integrated electronic protocols, aspects related to the patients themselves (e.g. pathologies and intrinsic motivation) could also play a role. One limitation is that it has not been possible to identify information about willingness to quit (Assess), although it does partially appear in the question related to ‘Agreeing a plan to give up smoking’. In addition, we should take into account the flaws inherent in employing questionnaires30. Nevertheless, the greatest strengths of our study are its representativeness, broad geographical area, sample size, and inclusion of both medical and nursing staff.
CONCLUSIONS
In our study, the Good Practice of public healthcare physicians and nurses is related to non-smoking, and suitable training and knowledge. The barriers to its improvement are lack of time and problems of organization. It is clear that training activities are needed within the Spanish National Health Service, with support from scientific societies, in order to prioritize care for the smoker.