INTRODUCTION
Alcohol and tobacco are both addictive and they are among the leading causes of preventable death in the United States1. They are often consumed together for various reasons. NESARC data have already indicated the widespread use of tobacco with alcohol2. It has been found that smokers are more likely to drink than non-smokers and people who drink are three times more likely to smoke2. Since both substances are readily available and often used in social gatherings, this may contribute to their co-use and abuse.
Both tobacco and alcohol are carcinogenic. It is well known that cigarette smoke contains more than sixty identified carcinogens. On the other hand, the metabolite of alcohol, acetaldehyde, is also a human carcinogen as denoted by the International Agency for Research on Cancer (IARC)3. Hence, the concurrent use of alcohol and tobacco is particularly worrying because it can increase the risk of various forms of cancer such as throat, pancreatic and esophageal cancers apart from cardiovascular diseases, more than when used alone4,5.
Studies have shown that there is cross-tolerance between alcohol and tobacco. The stimulating effect of nicotine is counteracted by the sedating effect of alcohol and this may cause smokers to drink more alcohol6. Alcohol’s sedating effects may attenuate the physiological effects of nicotine, enhancing increase in tobacco consumption. In addition, both alcohol and nicotine in tobacco act on the mesolimbic dopamine system of the brain and stress hormone systems, which results in the reinforcing, addicting and sensitizing effects upon repeated exposure to these substances7.
According to the Thematic Household Survey 2015 Report No.59 in Hong Kong, the prevalence of daily cigarette smokers among persons aged ≥15 years was 10.5%8. The Behavioural Risk Factor Survey April 2016 in Hong Kong reported that among people aged 18–64 years, 17.2% were regular drinkers who drank at least once a week. The males used alcohol more than females, with 25.0% of males drinking at least once a week compared to only 10.4% by females. The survey also revealed that 7.0% of people had binge drinking (consumed five or more glasses or cans of alcoholic drinks on each occasion) at least once a month, of which people aged 25–34 years had a higher rate of binge drinking9.
In order to help these alcohol users to quit smoking, a better understanding of the smokers who also drink is needed. There have been only a few studies on the concurrent prevalence and correlates of alcohol and tobacco use among adult populations from Asian countries10-12. Apparently, there is no recent survey on the co-use of alcohol and tobacco in Hong Kong. This study aims to examine the pattern on the co-use of alcohol and tobacco in relation to smoking cessation in Hong Kong.
METHODS
Study design and study sample
This study was a retrospective case review study on adult daily smokers who volunteered to receive quit smoking service in our Integrated Centre on Smoking Cessation (ICSC) from 1 January 2014 to 30 June 2017. The exclusion criteria were those aged ≤18 years, mentally unstable or cognitively impaired. The participants were recruited through a smoking cessation hotline, Facebook, referral from medical practitioners or self-referral. The ICSC was funded by the Department of Health, Hong Kong SAR government and it provided free pharmacotherapy and counseling service to smokers who were Hong Kong citizens. Integrated model of counselling and pharmacotherapy in smoking cessation intervention was adopted, as suggested in the practice guidelines for treating tobacco use and dependence13.
Experienced social workers who were trained in tobacco cessation were deployed to conduct counselling with motivational interviewing technique and cognitive behavioral therapy14. The medications provided included nicotine replacement therapy (NRT) and non-NRT. The NRT used included nicotine patch, gum and lozenges, and non-NRT included bupropion and varenicline. Intensive counselling sessions each lasting about half an hour were given once a week for two weeks and then once every two weeks until the end of treatment phase, which lasted from eight to twelve weeks. Smokerlyser by Bedfont Scientific Ltd was used to measure carbon monoxide level to document tobacco abstinence at each visit.
A structured questionnaire that had been tested and adopted by local researchers15,16 was given to patients with written consent at the first visit to collect the following baseline information: sociodemographic characteristics, past health, smoking conditions, Fagerström Test on Nicotine Dependence (FTND) score, and AUDIT score (The alcohol use disorders identification test on alcohol drinking)17.
Measurements
The Fagerström Test on Nicotine Dependence (FTND) is a validated questionnaire to assess nicotine dependence of a smoker on a scale 0–10. Scores ≥6 indicate nicotine dependence and 10 corresponds to the greatest dependence.
The Alcohol Use Disorders Identification Test (AUDIT) is a questionnaire to measure drinking status with 10 items rated on a 0–4 scale. The score of AUDIT ranges from 0–40 where 0 indicates the subject has never drunk in the past year. A score 1–7 suggests low alcohol consumption, a score 8–14 indicates hazardous or harmful alcohol consumption, and a score of ≥15 suggests the possibility of alcohol dependence or moderate–severe alcohol use disorder. The third question of AUDIT was used to detect any binge drinking problem.
Outcome measure
Participants were contacted by phone at week 26 and 52 to ascertain smoking status and abstinence. Data of all eligible participants from 1 January 2014 to 30 June 2017 were reviewed and analyzed. The outcome measure was self-reported 7-day point prevalence abstinence rate at week 26 and 52. Those who were lost to follow-up were treated as non-quitters based on an intention-to-treat analysis.
Statistical analysis
Statistical analyses were performed using STATA version 15 (StataCorp, 2017). The cut-off value for significance was set at p<0.05. Descriptive statistics were calculated for the sociodemographic variables (age, gender, marital status, education level, income), nicotine dependence (FTND), cigarettes/day, smoking self-efficacy, history of mental illness, feeling depressed in the past 2 weeks, number of previous quit attempts, current substance use, and hazardous alcohol drinking status (AUDIT). Categorical variables are presented as percentages, and the chi-squared test was used to detect significant differences between tobacco users only and alcohol and tobacco co-users. Due to the large sample size, the Shapiro-Francia W' test was performed to check for normality. Normally distributed continuous variables are presented as mean with standard deviation (SD). For continuous variables that were normally or not normally distributed, the t-test was used to compare means between tobacco users only and concurrent users of alcohol and tobacco. Previous research has found that t-tests can and should be used for heavily skewed data for studies with a large sample size. Chi-squared test was also used to detect significant differences between AUDIT score and quit rate at week 26 and week 52, as well as the significant differences between binge drinking and smoking quit rate at week 26 and week 52.
RESULTS
There were 4602 alcohol and tobacco co-users and 2732 tobacco only users (Table 1). Mean age for the former was 40.52 years and for the latter 45.2 years. Continuous variables, including cigarettes/ day, Fagerström score, number of quit attempts and scores of the importance, difficulty and confidence in quitting smoking were checked for normality. The p values for the Shapiro-Francia W' test were all <0.001, indicating that these variables were not normally distributed (Supplementary file Table 1). T-test and chi-squared test results showed that no statistical difference was found in cigarettes/day, Fagerström score, number of previous quit attempts, and current substance use between these two groups. On the other hand, co-users had higher education level and better income than tobacco only users. There were significantly more unmarried subjects and more male in the co-users, of whom 52.24% were aged 21–40 years. For these alcohol users, their mean AUDIT score was only 6.17 (SD: 5.67).
Table 1
Characteristics of the study population in Capital Region of Denmark in 2010, 2013 and 2017. Only persons with information on smoking and stress are included
| Characteristics | Tobacco only use (N=2732) | Alcohol and tobacco co-use (N=4602) | t or χ2 | p |
|---|---|---|---|---|
| Age (years), Mean (SD) | 45.20 (13.16) | 40.52 (11.99) | ||
| Age (years), n (%) | χ2=196.02 | <0.00001b | ||
| 13–20 | 35 (1.28) | 122 (2.65) | ||
| 21–40 | 1073 (39.30) | 2384 (51.80) | ||
| 41–60 | 1215 (44.47) | 1759 (28.22) | ||
| >60 | 391 (14.30) | 304 (6.61) | ||
| missing | 18 (0.65) | 33 (0.72) | ||
| Gender, n (%) | χ2=42.53 | <0.00001b | ||
| Male | 1984 (72.62) | 3648 (79.27) | ||
| Female | 748 (27.38) | 954 (20.73) | ||
| Marital status, n (%) | χ2=45.19 | <0.00001b | ||
| Married/cohabiting | 1627 (59.60) | 2649 (57.60) | ||
| Single | 714 (26.10) | 1505 (32.70) | ||
| Separated/widowed/divorced | 334 (12.20) | 406 (8.80) | ||
| Missing | 57 (2.09) | 42 (0.91) | ||
| Education level*, n (%) | χ2=68.44 | <0.00001b | ||
| Illiterate | 9 (0.33) | 9 (0.20) | ||
| Primary | 257 (9.37) | 258 (5.61) | ||
| Secondary | 1560 (57.10) | 2862 (62.19) | ||
| Post-Secondary | 283 (10.36) | 582 (12.64) | ||
| University | 231 (8.46) | 578 (12.56) | ||
| Missing | 392 (14.35) | 313 (6.80) | ||
| Monthly income** (HK), n (%) | N=2159 | N=3765 | χ2=103.17 | <0.0001b |
| <10000 | 481 (22.28) | 563 (14.95) | ||
| 10000–19999 | 902 (41.78) | 1762 (46.80) | ||
| 20000–29999 | 344 (15.93) | 870 (23.10) | ||
| ≥30000 | 432 (20.01) | 570 (15.15) | ||
| Missing | 573 (20.97) | 837 (18.19) | ||
| Cigarettes/day, Mean (SD) | 18.62 (9.13) | 18.14 (8.75) | t=2.19 | p=0.0282b |
| Fagerström score, Mean (SD) | 5.32 (2.37) | 5.23 (2.42) | t=1.67 | p=0.0956 |
| Confidence score, Mean (SD) | 63.62 (25.56) | 60.79 (22.79) | t=4.86 | p<0.0001b |
| Importance score, Mean (SD) | 81.58 (18.32) | 80 (18.62) | t=3.49 | p=0.0005b |
| Difficulty score, Mean (SD) | 73.23 (23.58) | 74.82 (25.26) | t=-2.654 | p=0.008b |
| History of mental illness***, n (%) | 485 (17.75) | 487 (10.58) | χ2=79.00 | p<0.0001b |
| Feeling depressed in the past 2 weeks, n (%) | 639 (23.38) | 1084 (23.55) | χ2=0.07 | p=0.936 |
| Number of previous quit attempts, Mean (SD) | 1.46 (2.84) | 1.52 (2.80) | t=0.8565 | p=0.3918 |
| Current substance use, n (%) | 7 (0.26) | 16 (0.35) | χ2=0.46 | p=0.498 |
| AUDIT scorea , n (%) | N=2732 | N=4602 | NA | |
| 0 | 2732 (100) | NA | ||
| 1–8 | NA | 3427 (74.50) | ||
| 9–15 | NA | 800 (17.40) | ||
| 16–19 | NA | 200 (4.34) | ||
| ≥20 | NA | 173 (3.76) | ||
| Mean (SD) | NA | 6.17 (5.67) |
Univariate analysis of co-users of alcohol and tobacco revealed that age, female gender, married, divorced, separated and widowed, lower education level and lower personal income were associated with higher odds of co-use of these substances, whereas Fagerström score, cigarettes/day and previous quit attempts were not associated with co-use (Table 2). Multivariate analysis showed that age and gender were associated with co-use while a high monthly personal income ≥30000 HK (1000 Hong Kong dollars about 130 US$) had lower odds of co-use (Table 3).
Table 2
Adjusted odds ratios (AOR) and 95% CI for current co-users of tobacco and alcohol as determined by univariate analysis, Hong Kong 2014–2017
| Variables | AOR | 95% CI | p |
|---|---|---|---|
| Age (years) | 1.030 | 1.026–1.034 | <0.0001a |
| Gender | |||
| Male (Ref.) | 1 | ||
| Female | 1.442 | 1.291–1.610 | |
| Marital status | |||
| Single (Ref.) | 1 | <0.0001a | |
| Married/cohabiting | 1.295 | 1.162–1.443 | <0.0001a |
| Divorced/widowed/separated | 1.734 | 1.463–2.055 | |
| Education | |||
| Primary or below (Ref.) | 1 | <0.0001a | |
| Secondary | 0.547 | 0.457–0.655 | <0.0001a |
| Post-Secondary | 0.488 | 0.391–0.609 | <0.0001a |
| University | 0.401 | 0.319–0.504 | |
| Monthly income (1000×HK) | |||
| <10 (Ref.) | 1 | 0.658 | |
| 10–19.9 | 1.060 | 0.819–1.371 | 0.002a |
| 20–29.9 | 0.685 | 0.540–0.870 | <0.0001a |
| ≥30 | 0.505 | 0.405–0.631 | 0.096 |
| Fagerström score | 1.017 | 0.997–1.037 | 0.028a |
| Mean cigarettes/day | 1.006 | 1.001–1.011 | |
| Previous quit attempts | |||
| No (Ref.) | 1 | 0.903 | |
| Yes | 1.007 | 0.901–1.126 |
Table 3
Adjusted odds ratios (AOR) and 95% CI for current co-users of tobacco and alcohol as determined by multiple logistic regression analysis, Hong Kong 2014–2017
| Variables | AOR | 95% CI | p |
|---|---|---|---|
| Age (years) | 1.025 | 1.018–1.031 | <0.0001a |
| Gender | 1.388 | 1.187–1.623 | <0.0001a |
| Marital status | |||
| Single (Ref.) | 1 | ||
| Married/cohabiting | 1.024 | 0.884–1.185 | 0.755 |
| Divorced/widowed/separated | 1.011 | 0.801–1.275 | 0.927 |
| Education | |||
| Primary or below (Ref.) | 1 | ||
| Secondary | 1.051 | 0.807–1.370 | 0.710 |
| Post-Secondary | 1.073 | 0.785–1.466 | 0.658 |
| University | 0.977 | 0.710–1.344 | 0.885 |
| Monthly income (1000×HK) | |||
| <10 (Ref.) | 1 | ||
| 10–19.9 | 1.026 | 0.773–1.362 | 0.858 |
| 20–29.9 | 0.747 | 0.573–0.973 | 0.030a |
| ≥30 | 0.568 | 0.442–0.729 | <0.0001a |
| Fagerström score | 1.000 | 0.967–1.034 | 0.989 |
| Mean cigarettes/day | 1.005 | 0.996–1.015 | 0.244 |
| Previous quit attempts | 1.035 | 0.900–1.190 | 0.631 |
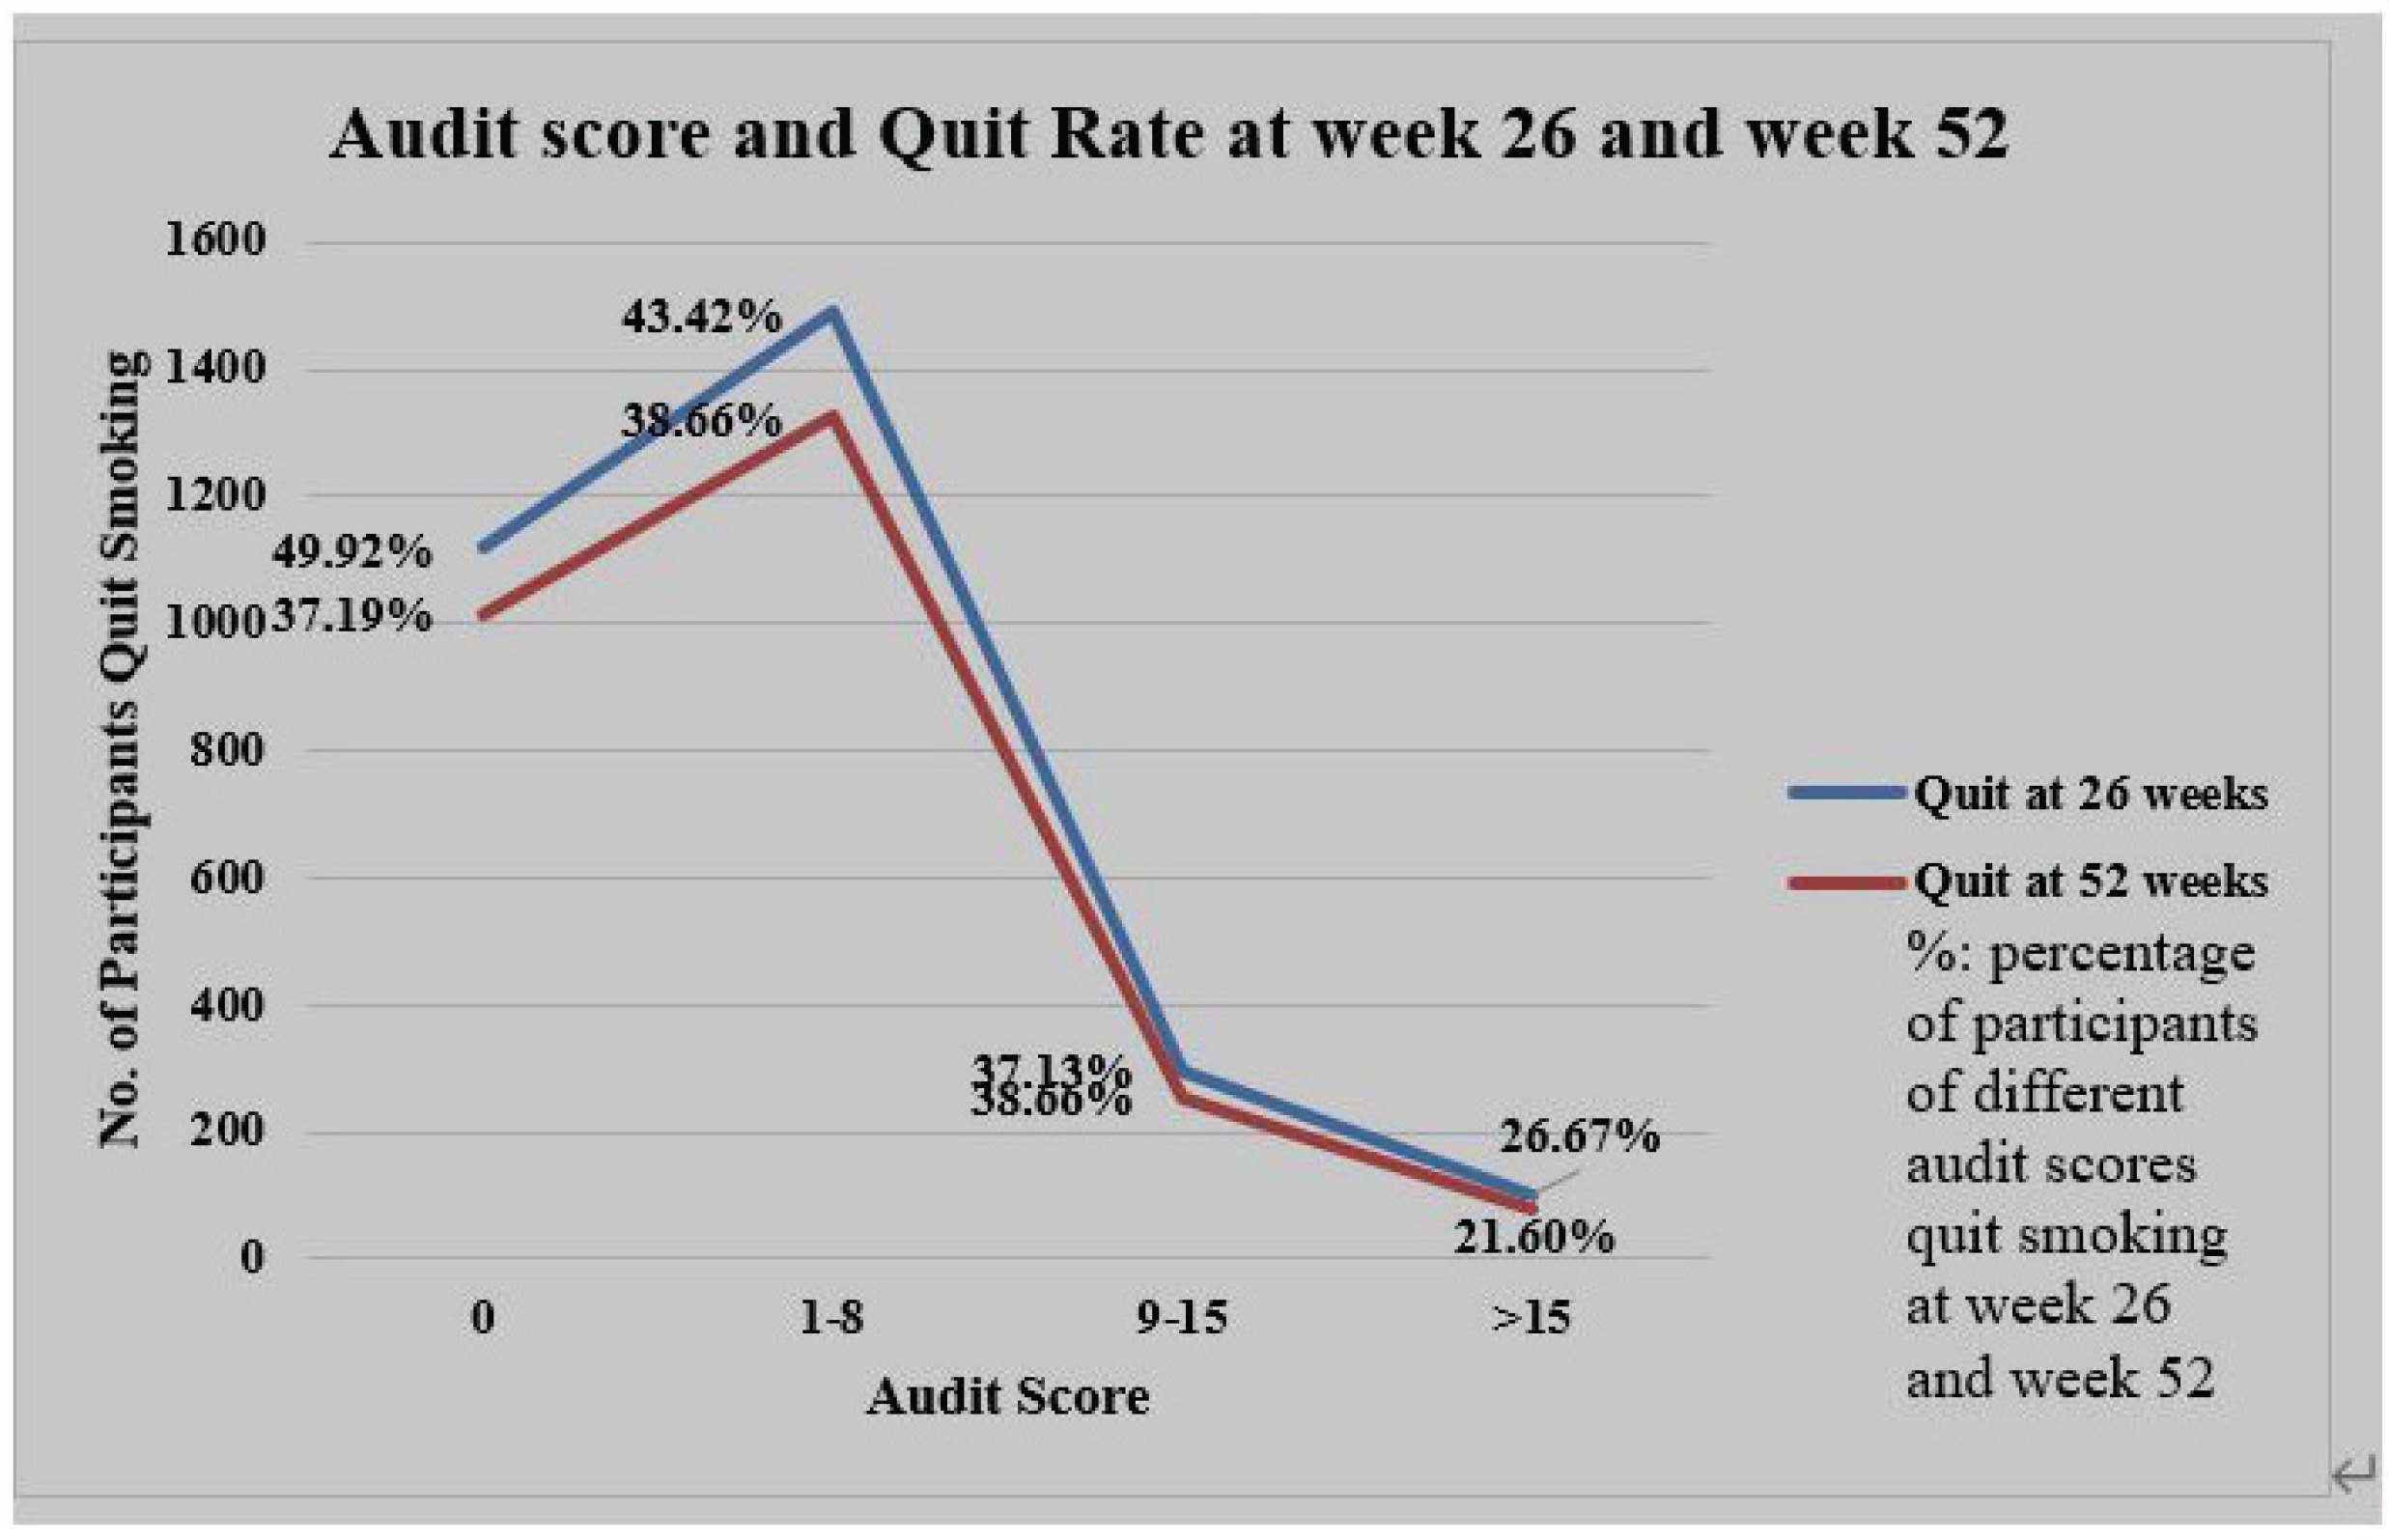
In Table 4, the abstinence rate at week 26 for drinkers was 40.96% (95% CI: 0.395–0.424) versus 40.92 (95% CI: 0.391–0.428) for non-drinkers, and at week 52 it was 36.09% (95% CI: 0.347–0.375) vs 37.19% (95% CI: 0.354–0.390), respectively. However, for heavy drinkers with AUDIT score >15, the abstinence rate dropped to 26.67% (95% CI: 0.224–0.314) at week 26 and 21.6% (95% CI: 0.177– 0.261) at week 52. As shown in Figure 1, there is a decreasing trend in the quit rate as the AUDIT score increases. Table 5 also shows that the quit rate of those who never binge drank, or binge drank less than once a month, was significantly higher than those who engaged in binge drinking more than once a month, at week 26 and week 52.
Table 4
Relationship between AUDIT score and quit rate at 26 and 52 weeks
Table 5
Relationship between binge drinking and quit rates at 26 and 52 weeks
| Binge drinking vs quit rate | Binge drinking never or less than once a month (N=3605) n (%) | Binge drinking at least once a month (N=1073) n (%) | χ2 | Logistic regression coefficient | 95% CI | p |
|---|---|---|---|---|---|---|
| Quit rate at 26 weeks | 19.18 | 0.34 | 0.189–0.497 | p<0.0001a | ||
| Quit | 1557 (43.19) | 367 (34.20) | ||||
| Did not quit | 1433 (39.75) | 476 (44.36) | ||||
| Missing | 615 (17.06) | 230 (21.44) | ||||
| Quit rate 52 weeks | 38.22 | 0.50 | 0.036–0.383 | p<0.0001a | ||
| Quit | 1406 (39.00) | 295 (27.49) | ||||
| Did not quit | 1486 (41.22) | 516 (48.09) | ||||
| Missing | 713 (19.78) | 262 (24.42) |
DISCUSSION
Prevalence of alcohol and tobacco use in other countries and in Hong Kong
Tobacco and alcohol use are personal life-style choices and yet have an important public health impact. The US National Epidemiologic Survey on Alcohol and Related Conditions (NESARC) in 2001 indicated the widespread co-use of alcohol and tobacco in the USA: 21.7% of adults used both alcohol and tobacco, representing approximately 46.2 million people. Younger people tended to have a higher prevalence of alcohol use disorders, nicotine dependence and co-use18. Tobacco and alcohol co-use varied with age, gender and ethnicity, and men had higher rates of co-use than women19.
There are only a few studies on tobacco and alcohol co-use in Asian countries. In Thailand, the prevalence of current smoking with harmful and hazardous alcohol consumption was 10.2%20. In Cambodia, the Tobacco Control Leadership Training Survey of 2005–2006 revealed that 40–55 % of male smokers used alcohol in the past week12. In India, the prevalence of co-use of tobacco and alcohol among men aged 18–59 years was 23.5%. In Hong Kong we did not have any data on prevalence of concurrent use of alcohol and tobacco in adults10.
Alcohol consumption per capita varies significantly between countries with different economic status, culture and religion. Globally, it was estimated that 6.42 L pure alcohol per capita were consumed by the adult population (aged ≥15 years) in 201521. According to the WHO Global status report on non-communicable diseases 2011 in Asia, the Republic of Korea consumed 14.81 L per capita, China consumed 5.56 L per capita, and Singapore 1.54 L per capita22, while the alcohol consumption per capita in Hong Kong was estimated to be 2.64 L in 2010.
In Hong Kong, the behavioral risk factor survey conducted by the Department of Health HKSAR in 2016 indicated that 70.5% of the respondents reported that they had a drink containing alcohol during the past year. On the other hand, 29.5% of the respondents reported that they had never drunk alcohol during the past year prior to the survey; 4.0% reported drinking daily and about 40.0% reported drinking less than once a month23.
In contrast to population surveys in other countries, the current study was on smokers in a smoking cessation service, and it revealed that 37.3% of all smokers never use alcohol whereas 62.7% of the smokers were current users of alcohol in the past year, with various quantities and frequencies. In two population surveys in Canada, the Canadian Community Health Survey (CCHS) and the Canadian Alcohol and Drug Monitoring Survey (CADUMS), 24% of current smokers scored >8 on the AUDIT scale23. Our study yielded a similar finding on smokers, with 25.5% scoring >8 on AUDIT scale.
Alcohol and quitting smoking
Greater alcohol consumption is associated with decreased odds of smoking cessation24,25. In our study, the quit rate between tobacco and concurrent alcohol and tobacco users did not differ appreciably. This might be due to the fact that most of our smokers were mild to moderate drinkers as 74.5% had AUDIT scores <9. However, as seen in Figure 1, there is a decreasing trend of quitting as the AUDIT score increases. When we dichotomize alcohol users with AUDIT score >15, there is a significant decrease in quit rate in this group and this concurs with overseas findings.
Illicit drug use and smoking
The US National Survey on Drug Use and Health among persons ≥12 years (NSDUH) 2002–2014 revealed that approximately 20.81% of cigarette smokers also used an illicit drug in the past month26. In Hong Kong, the prevalence of illicit drug use alone is much lower than in Western countries. The prevalence of 6-month substance use for males aged 18–60 years was estimated to be 4.4%27. There is apparently no local population studies on the concurrent use of tobacco and illicit drugs. The current cohort study, which is not a population survey, only revealed 0.26 % smokers had past-year substance use while only 0.35% tobacco and alcohol co-users had past-year substance use.
Correlates of co-use of alcohol and tobacco
Several studies have investigated the relationship between socioeconomic factors and the prevalence of smoking or alcohol drinking separately, but few studies have investigated the relationship between socioeconomic factors and concurrent tobacco and alcohol consumption28,29.
In a Thailand study, alcohol and tobacco co-users were mostly illiterate, manual workers30. In an Indian study, an inverted U or V-shape relation on age was found in tobacco and alcohol co-users10. The prevalence was lowest for age groups 18–24 and 50–59 years. Their main risk factors for high rate of co-use were low education level and working in the informal sector. There are some similarities with our study where co-users are less educated with lower personal income, and higher prevalence in the age group 21–40 years. One interesting finding is that our female smokers are more likely to be co-users of alcohol. This might be due to the fact that our female population is more affluent, and socially and financially independent. However, this needs to be confirmed by further studies.
Limitations
There are some limitations in this study. First, analyses are based on retrospective case review design and therefore the sampling frame is restricted to users of our service. Data on tobacco and alcohol use are entirely based on participants’ self-report. People who are co-using may be using cigarettes and alcohol at the same time while in social gatherings or they might just be using both substances at separate times. We have no data on how they use both substances in these two different situations. The intensity and frequency of alcohol use is assessed by the AUDIT score and the quantity of alcohol consumption is not evaluated. The quit rate was self-reported and not biochemically validated.
CONCLUSIONS
This study highlights the importance of noting the co-occurrence of alcohol and tobacco. The current study and other studies have documented that tobacco and nicotine can increase alcohol use and smoking relapse. We should acknowledge the effect of alcohol– tobacco interaction and try to reduce alcohol use and prevent smoking relapse in a more proactive manner in smoking cessation interventions. To improve the health condition of the smoking population, policies and strategies must be formed to reduce the co-use of tobacco and alcohol, especially targeted at those with lower education level and economic status. Increasing health education and awareness about the harmful effects of tobacco and alcohol use can reduce co-occurrence of tobacco and alcohol. Sherry et al.31 have remarked that in general, there has been a lack of attention to alcohol consumption in the smoking cessation literature. It is worth screening people on alcohol use during smoking cessation interventions so that appropriate advice on alcohol use can be given.