INTRODUCTION
Tobacco use is one of the leading preventable causes of premature death worldwide1. Almost 7 million deaths every year are attributed to the use of tobacco. Most of these deaths occur in low and middle income countries, which account for almost 80% of all tobacco-related deaths2. The South-East Asia region mainly consist of developing countries, where tobacco use is a major public health problem. Tobacco kills nearly 1.2 million people annually in this region3.
India is the third largest tobacco producing nation and the second largest consumer of tobacco worldwide4. Deaths due to tobacco in India are estimated to be about 1 million, among which 0.926 million are attributed to tobacco smoking and the rest to smokeless tobacco use5. In India, tobacco is used in various forms ranging from smoked to smokeless tobacco. Approximately 266.8 million adults used tobacco during 2016–2017, of which 99.5 million used smoked tobacco6.
In spite of India’s government regulatory action towards tobacco control, tobacco use among youths and young adults is quite high, due to the industry’s creative branding and targeted marketing strategies. Other contributing factors to the epidemic are abundant tobacco production, weak enforcement of tobacco control measures, and easy accessibility and affordability of tobacco products3. Despite these challenges, India has addressed this problem significantly at various levels. At the national level, the Cigarettes and Other Tobacco Products Act (COTPA) was enacted in 2003, followed by the ratification of the World Health Organization’s Framework Convention on Tobacco Control (WHO FCTC) in 20047. In addition, the government initiated tobacco control and prevention programs at the state level to support tobacco cessation efforts and capacity building7. The decreased prevalence of tobacco use can also be attributed to the advocacy efforts for tobacco control initiatives by civil society organizations and community along with government’s initiatives7.
Monitoring of the tobacco epidemic is the key to managing it effectively. The Global Adult Tobacco Survey (GATS) fills the need for standardized surveys of tobacco use, which uses a standardized protocol to ensure comparability, to track tobacco use, and evaluate tobacco control policies. These measures have been defined by the WHO FCTC8.
Given the current gap in the literature and WHO’s recommendation to strengthen tobacco use surveillance and monitoring among various groups9,10, there is a need to understand the epidemiology of tobacco use patterns and predictors, and investigate whether it is a public health concern among college students in South India. Therefore, the objectives of this study were to estimate the current patterns of tobacco use among college students, to investigate the predictors of tobacco smoking among them, and to find the factors associated with an attempt to quit smoking. It is hoped that this research will provide a baseline for the national prevalence of tobacco use among college students and tobacco specific interventions in South India. It is also hoped that the results of this study can place the prevalence of tobacco use within regional and global context, so that future comparisons can be made.
METHODS
A cross-sectional study was conducted to assess tobacco use among college students aged 18–24 years and studying in Mangalore, South India. The study was carried out in 30 colleges in Mangalore from January 2016 to June 2018. Before initiating the study, official permission was obtained from the Joint Director of Education, Mangalore, and the heads of the institutions of the selected colleges. Ethical clearance was obtained from Yenepoya (Deemed to be University) Ethics Committee (YUEC) (YUEC 200/12/10/2015). Informed consent was obtained from the study participants prior to the start of the study.
Sample size
The sampling frame comprised all the college students studying in Mangalore. Based on the total number of students in this region, a sample size of 2063 was calculated with confidence interval 95%, error 3% for a tobacco use rate of 40%11, and assuming a design effect of 2%. The sample size was calculated from OpenEpi Info Version 3, open source calculator – SS proper, derived using the values based on the least prevalence of tobacco use.
Sampling procedure
The sampling procedure was carried out in three stages. A geographically clustered multistage random sampling was used to identify the study areas. Among the colleges, using proportionality sampling (20% proportion), n=30 colleges were randomly selected as the primary sampling units using the following formula: total number N of colleges in Mangalore = 148, thus n=148 × 20/100 = 30.
Secondly, information regarding the total strength of each sampling unit was collected and further study participants were selected using the formula: a×b/N (a=study subjects from the college, b=2063 and N=148). Finally, the study subjects were selected randomly. Students who were native of Mangalore and present on the day of data collection were included in the study.
Data collection
The proforma used to collect the data was a component of Global Tobacco Surveillance System (GTSS), which uses a standard core questionnaire that was approved and validated by experts in the field of epidemiology at Yenepoya (Deemed to be University). The questionnaire was pilot tested on 25 college students to assess the feasibility of the study design. The proforma also consisted of demographic data such as age, gender, course, and location of residence. In addition to this, tobacco use habits, tobacco use predictors, and factors associated with an effort to quit smoking, were assessed.
Data were collected through face-to-face personal interviews12. The interview was conducted by a single examiner. The present study provides a standardized protocol for consistent monitoring of tobacco use, estimates of tobacco use, exposure to secondhand smoke, and quit attempts among adults, and indirectly measures the impact of tobacco control and prevention initiatives.
In order to obtain data regarding current tobacco smoking status, the respondents were asked: ‘Do you currently smoke tobacco on a daily basis, less than daily or not at all?’. To get data regarding past smoking status, they were asked: ‘In the past, have you smoked tobacco on a daily basis, less than daily, or not at all?’. Similarly, questions regarding smokeless tobacco (SLT) use were also asked. In the GATS, current tobacco smokers correspond to the percentage of respondents who currently smoke tobacco. According to the GATS, daily smoker means smoking at least one tobacco product every day or nearly every day over a period of a month or more. In this study, the primary outcome variable was whether the respondent was a current tobacco smoker and the secondary outcome variable was whether the respondent was a current smokeless tobacco user. The covariates included a number of demographic characteristics.
Statistical analysis
Statistical analysis was performed with SPSS Version 24.0. Descriptive statistics are presented in the form of frequency and percentage. Chi-squared test was used to test association between overall tobacco smoking status and demographic characteristics of the participants, and also between attempt to quit smoking and other study variables. Logistic regression analysis was performed to determine factors influencing tobacco smoking and factors influencing attempt to quit by current smokers. A p value <0.05 was considered statistically significant.
RESULTS
The present study involved 2063 participants who completed the interview. Among them, 738 were males and 1325 were females. Table 1 shows the prevalence of different forms of tobacco use (smoking and smokeless). Among the 2063 participants, 4.8% (96) were current tobacco smokers; among the current tobacco smokers, 9.9% (69) were males and 2.1% (27) were females. Among them, 1.7% (35) smoked daily, and 3.1% (61) smoked occasionally. The prevalence of smokeless tobacco (SLT) use in the study population was 4.8% (96) among which 7.4% males (53) and 3.3% females (43) consumed smokeless tobacco. It was observed that among the current tobacco chewers, 2.1% (43) chewed tobacco on a daily basis and 2.6% (53) chewed tobacco occasionally in the past.
Table 1
Detailed tobacco smoking and smokeless tobacco use status by gender, 2016–2018 (N=2063)
Table 2 shows the association between tobacco smoking status and demographic characteristics. There was no significant association (p>0.05) between demographic variables, such as age and location of residence, and current tobacco smoking status. However, gender and education degree showed significant (p<0.05) association with the current tobacco smoking status. Majority of the participants who currently did not smoke tobacco were females (98.0%), aged 18 years (96.4%), from a rural area (95.7%), and pursuing a technical degree (98.3%).
Table 2
Association between overall tobacco smoking status and demographic characteristics of participants, 2016–2018 (N=2063)
| Characteristic | Category | Current tobacco smoking status | Total | Significance | |
|---|---|---|---|---|---|
| Non-smoker n (%) | Smoker n (%) | n | |||
| Gender | Male | 669 (90.7) | 69 (9.3) | 738 | χ2=57.12 |
| Female | 1298 (98.0) | 27 (2.0) | 1325 | p=0.001* | |
| Age (years) | 18 | 540 (96.4) | 20 (3.6) | 560 | |
| 19 | 554 (95.8) | 24 (4.2) | 578 | χ2=6.27 | |
| 20 | 665 (95.0) | 35 (5.0) | 700 | p=0.09 | |
| 21–24 | 208 (92.4) | 17 (7.6) | 225 | ||
| Location | Urban | 1182 (95.1) | 61 (4.9) | 1243 | χ2=0.46 |
| Rural | 785 (95.7) | 35 (4.3) | 820 | p=0.50 | |
| Degree | Undergraduate | 1403 (94.6) | 80 (5.4) | 1483 | |
| Technical | 116 (98.3) | 2 (1.7) | 118 | χ2=6.91 | |
| Health professional | 448 (97.0) | 14 (3.0) | 462 | p=0.03* | |
Logistic regression analysis to determine factors influencing tobacco smoking showed that males have 0.20 more odds of being a smoker than females. Participants aged 21–24 years have 2.82 higher odds of being a smoker than participants aged 18 years. Participants in an urban area have 0.97 more odds of being a smoker than participants in a rural area. Health professional students have 0.74 more odds of being a smoker than undergraduate degree students (Table 3).
Table 3
Logistic regression analysis to determine factors influencing tobacco smoking, 2016–2018 (N=2063)
| Variable | B | S.E. | Wald | Df | p | OR | 95% CI |
|---|---|---|---|---|---|---|---|
| Gender (Male) | -1.63 | 0.24 | 46.36 | 1 | <0.001* | 0.20 | 0.12–0.31 |
| Age (18 years) | - | - | 9.35 | 3 | 0.03* | - | - |
| Age (19 years) | 0.32 | 0.31 | 1.03 | 1 | 0.31 | 1.38 | 0.74–2.54 |
| Age (20 years) | 0.55 | 0.29 | 3.49 | 1 | 0.06 | 1.73 | 0.97–3.06 |
| Age (21–24 years) | 1.04 | 0.35 | 8.69 | 1 | 0.003* | 2.82 | 1.42–5.62 |
| Location (Urban) | -0.03 | 0.22 | 0.01 | 1 | 0.91 | 0.97 | 0.63–1.51 |
| Degree (Undergraduate) | - | - | 5.41 | 2 | 0.07 | - | - |
| Degree (Technical) | -1.58 | 0.73 | 4.72 | 1 | 0.03* | 0.21 | 0.05–0.86 |
| Degree (Health professional) | -0.30 | 0.31 | 0.92 | 1 | 0.34 | 0.74 | 0.41–1.36 |
| Constant | -2.55 | 0.25 | 106.82 | 1 | <0.001* | 0.08 | - |
Table 4 shows distribution of factors associated with subjects who attempted to quit smoking in past 12 months. No significant difference was observed between the attempt to quit between a daily smoker and less than daily smoker (p=0.35). Among participants who noticed anti-cigarette information in newspapers, 78.6% attempted to quit and 21.4% did not attempt to quit. The odds of quitting the habit by a smoker were 3.9 times higher than those who had not seen any information (p=0.005). Among the participants who noticed anticigarette information on television, 71.4% made an attempt to quit smoking. The odds ratio of quitting smoking was 4.4 times more compared to subjects who did not notice any information on television (p=0.002). Among the participants, 72% attempted to quit smoking after seeing the health warnings on the cigarette packet and 7.1% of the subjects did not notice any such warnings. The odds of quitting the habit after seeing the packet were 33.3. Study participants who had noticed advertisements in stores were 2.41 times more likely to quit the habit compared to those who did not notice such advertisements (p=0.04).
Table 4
Distribution of the factors associated with subjects attempting to quit smoking in the past 12 months with different study variables, 2016–2018 (N=2063)
| Variable | Category | Attempting to quit smoking | Significance | OR | 95% CI | ||
|---|---|---|---|---|---|---|---|
| Yes n (%) | No n (%) | Total n | |||||
| Current tobacco smoking status | Daily | 24 (68.6) | 11 (31.4) | 35 | χ2=0.87 | 1.52 | 0.6–3.6 |
| Less than daily | 36 (59.0) | 25 (41.0) | 61 | p=0.35 | |||
| Noticing anti-cigarette information in newspapers/magazines | Yes | 44 (78.6) | 12 (21.4) | 56 | χ2=7.84 | 3.95 | 1.4–10.6 |
| No | 13 (48.1) | 14 (51.9) | 27 | p=0.005* | |||
| Noticing anti-cigarette information on television | Yes | 50 (71.4) | 20 (28.6) | 70 | χ2=9.83 | 4.44 | 1.6–11.6 |
| No | 9 (36.0) | 16 (64.0) | 25 | p=0.002* | |||
| Noticing health warnings on cigarette packs | Yes | 59 (72.0) | 23 (28.0) | 82 | χ2=21.43 | 33.35 | 4.1–26.9 |
| No | 1 (7.1) | 13 (92.9) | 14 | p<0.001* | |||
| Cigarette advertising in stores | Yes | 37 (72.5) | 14 (27.5) | 51 | χ2=4.17 | 2.41 | 1.0–5.6 |
| No | 23 (52.3) | 21 (47.7) | 44 | p=0.04* | |||
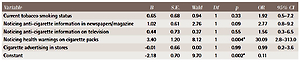
Logistic regression analysis to determine the factors influencing attempt to quit by current smokers showed that noticing health warnings on the cigarette packs in the last 30 days strongly influenced individual’s interest to quit the smoking habit with odds ratio of 30.0. Noticing anti-cigarette information in newspapers or magazines had 2.7 more odds of quitting the habit by current smokers (Table 5).
Table 5
Logistic regression analysis to determine the factors influencing attempt to quit by current smokers, 2016–2018 (N=2063)
| Variable | B | S.E. | Wald | Df | p | OR | 95% CI |
|---|---|---|---|---|---|---|---|
| Current tobacco smoking status | 0.65 | 0.68 | 0.94 | 1 | 0.33 | 1.92 | 0.5–7.2 |
| Noticing anti-cigarette information in newspapers/magazine | 1.02 | 0.61 | 2.76 | 1 | 0.09 | 2.77 | 0.8–9.2 |
| Noticing anti-cigarette information on television | 0.44 | 0.73 | 0.37 | 1 | 0.55 | 1.56 | 0.3–6.5 |
| Noticing health warnings on cigarette packs | 3.40 | 1.20 | 8.12 | 1 | 0.004* | 30.09 | 2.8–313.0 |
| Cigarette advertising in stores | -0.01 | 0.66 | 0.00 | 1 | 0.99 | 0.99 | 0.2–3.6 |
| Constant | -2.18 | 0.70 | 9.70 | 1 | 0.002* | 0.11 |
DISCUSSION
Our study is one of the largest studies that have been done in college students in Southern India to determine the prevalence of both smoking and smokeless tobacco use. Despite the increase in population in India in the last decade, there is a significant relative decline in tobacco use among youth in India6. According to the data gathered from the GATS-2 India 2016–2017, 18% were aged 15–24 years. The total number of tobacco users in this age group was 12.4% and non-users were 87.6%. Among these, 1.8% were dual users who smoked and chewed tobacco6. From GATS-1 in 2009–2010 to GATS-2 in 2016–2017, the prevalence of use of any form of tobacco in those aged 15–24 years has decreased significantly by 9.7% from 22.1% to 12.4%. Compared to the 2016–2017 survey by GATS, India, the present study reported a significantly lower number of tobacco users in this age group. The scientific literature reveals low prevalence of tobacco use in this age group, and this could be because the addiction level is not high and the habit is not deep-rooted. It might also be due to underreporting13. A low prevalence of tobacco use was earlier reported among adolescents in studies conducted by Ibehcc et al.14 and Nwarfor et al.15, at 7.7% and 8.7%, respectively. In contrast, several studies reported high tobacco use in adolescents in Akwa Iban, South Nigeria by Abaslubong et al.16, in Navi Mumbai by Salvi et al.17, and the US National Youth Tobacco Survey by Lee et al.18.
The prevalence of all types of tobacco use was higher among males compared to females. In the present study, males had 0.2 more odds of being a smoker than females. Similar findings are reported among adolescents and adults in a study done by Sharma et al.19. The tobacco product most commonly used by both genders was cigarettes. This calls for interventions that target tobacco production and sale.
Gender plays an important role in predicting smoking. Palipudi et al.20 reported a lower proportion of female smokers, while studies by Sharma et al.21 and Sreeramareddy et al.22 showed that there were no female smokers in their sample at all. However, these findings may not reflect data from other parts of the world. Hammond et al.23 reported that females were more likely to smoke than males on a daily basis, although the number of smoked cigarettes was lower. Studies conducted in India by Goel et al.24 and Roy et al.25 show a significant rise in the trend of female smoking compared to males. This situation is always challenging for policymakers to plan youthfocused tobacco interventions. The low prevalence of smoking observed among women, compared to men, could be attributed to social stigma. According to the 1992 WHO report on women and tobacco, smoking by women is often socially unacceptable in many of the developing countries26.
The findings of the current study are that the prevalence of tobacco use increases with age. A similar trend was reported in earlier studies14,27. Participants aged 21–24 years had 2.8 higher odds of being a smoker than participants aged 18 years. The possible reasons could be a younger age of initiation, and curiosity and aggressive advertisement or promotional tactics of the industry targeting youth. Creating awareness among the younger generation, about addictions and the associated dangers of the habits, could possibly reduce addiction among new smokers including increasing the age for buying tobacco products at the point-of-sale (POS) from the existing 18 years to 21 years. This could be used as a useful strategy to curb the initiation of tobacco products28. In our study, a relative reduction and a downward trend in the prevalence of smoking was observed. The prevalence rate was lower compared to studies done in Thailand and Bangladesh29,30.
In the present study, 4.8% of the study population used smokeless tobacco. This showed a decreased trend in the prevalence of chewed tobacco compared to GATS-2 (2017) that showed 9.1% in those aged 15–24 years. Comparing smoking products, the use of SLT is much more common among the youth and adults in India, Thailand, Bangladesh and Pakistan6,31. In India, although the prevalence of SLT use is lower, it is much higher than that of tobacco smoking6. Daily SLT users (2.1%) among the population of the current study are more compared to those smoking tobacco (1.7%). The pattern suggests that the use of SLT is still better accepted socially than tobacco smoking.
In our study, current smokers either smoked cigarettes or bidis, as these are the most commonly available forms of tobacco. Although smoking bidis is likely to be socially undesirable in educated circles, the likely explanation for its use could be that bidis are a relatively cheap product, which makes it affordable to college students. This trend is most commonly seen in the Southeast Asian countries20,32.
During the 30 days preceding the present study, nearly equal proportions of males and females found anti-smoking information in a public site or channel (print, electronic media, internet, public wall, and transport). Television was the medium where the highest percentage (70.66%) of the participants noticed anti-smoking information. As a consequence of noticing the health warnings on the product/ packet, the desire to quit was relatively high. Yet they were not able to quit, may be due to absence of alternate products or professional help to motivate them to quit smoking. Such a situation in India is alarming, since there is a paucity of information and effective cessation aids such as individual therapy, reading materials, group therapies, and nicotine replacement therapies (NRTs). The findings of the present study are in line with other studies conducted by Spaulding et al.33, Valera et al.34, and Coppo et al.35. Studies have suggested that the prohibition of tobacco advertising has led to tobacco companies’ formal contractual agreements regarding brand display within the film industry. The evidence is that images of tobacco use in movies of ‘bollywood’ and regional languages have increased post-implementation of the COTPA35,36. In the present study, the odds of quitting the habit after seeing the packet were 33.35, suggesting that noticing health warnings on the cigarette packet significantly influenced the subjects. The COTPA rules post-FCTC might have had a major impact on adult smokers to quit the habit after noticing the pictorial images. The present study also showed a strong response to specific package warnings with the likelihood of quit attempts, consistent with previous studies37,38.
Strengths and limitations
To the best of our knowledge the current study is the largest study in South India that provides information on the prevalence of tobacco use among college students. This study can act as a baseline for future studies. Our study utilizes the core questions from GATS, which will enable and support comparisons both locally and regionally. The study is subject to limitations. In our study setting, social norms (i.e. unacceptability of females using tobacco) might have resulted in underreporting or mis-reporting. In addition, the cross-sectional nature of the research hampers the ability to make any temporal associations. Also, with regard to tobacco use patterns and predictors, the sample size of the study was small. Further studies with larger sample size can provide more insight into tobacco use patterns and predictors.
CONCLUSIONS
The study results showed a low prevalence in the use of both smoked and smokeless forms of tobacco, current smoking, and tobacco chewing, among the study population in Mangalore, South India. Cigarettes were the most preferred tobacco product among the college students. Health professionals, educators and policymakers should adopt specific strategies to prevent youth from using tobacco. Generating data in this part of the country on tobacco use and developing tobacco control measures at regular intervals is essential to better understand and develop effective intervention programs for college students.