INTRODUCTION
In India, tobacco is consumed in a variety of forms ranging from smoked tobacco products, such as cigarettes and bidis, to several types of smokeless tobacco products. An estimated 266.8 million adults in India used tobacco during 2016–2017, of which 99.5 million smoked tobacco1. India has the second largest number of adults who smoke in the world2; the most commonly smoked tobacco product in India is bidis, which are smoked by an estimated 71.8 million adults1.
Bidis are thin hand-rolled cigarettes made from locally grown coarse tobacco flakes and handrolled in temburni leaf3. They may be tied up with a thread and may be flavored or unflavored. Bidis, which are mostly produced and sold by small cottage industries4, have a long history in India dating back to the 16th century4. Thus, bidi smoking has been entrenched in the Indian culture for a long time, which, in turn, has affected beliefs about smoking5.
Along with manufactured cigarettes (cigarettes) and other smoking tobacco products, bidis are major risk factors for tobacco-related diseases and deaths in India3,6. Data have also shown that bidis deliver higher levels of nicotine and cancer-causing chemicals than manufactured cigarettes7,8,9. It has been linked to diseases, such as lung and oral cancers, as well as respiratory diseases, heart attacks, and tuberculosis10. This has caused substantial economic burden on smokers and on their families and the nation. Bidi smoking attributable total direct and indirect costs among the 30–69 years age group has been estimated to be INR805.5 billion (US$12.4 billion) or INR1588 per capita in 201711. In addition, direct medical costs were estimated at INR168.7 billion (US$2.6 billion) thereby contributing 20.9% of the total costs11.
Bidis are relatively cheap, priced much lower than manufactured cigarettes11,12, and readily available in India, allowing easy access and affordability of the product, particularly among people of low socioeconomic status (SES)11. Based on the literature, SES in this context refers to the social and economic factors that influence what status individuals or groups have within the structure of society13,14 and affects the use of tobacco. For example, evidence has shown that bidi smoking is significantly higher among low SES population such as among those in rural areas, uneducated poor people, and the socially disadvantaged castes of Indian society15.
Despite these challenges, India has made significant efforts in addressing the problem of tobacco use at various levels by both governmental agencies and non-governmental organizations16. At the national level, the Indian government implemented the Cigarettes and Other Tobacco Products Act (COTPA) in 2003 and followed this with the ratification of the World Health Organization’s Framework Convention on Tobacco Control (WHO FCTC) in 200417. In addition, the government initiated tobacco control and prevention programs at the state level to support tobacco cessation efforts and capacity building17. Advocacy efforts for tobacco control initiatives by the civil society and the community have also complemented government efforts to reduce the prevalence of tobacco use in the country17.
Understanding the patterns and characteristics of people who smoke bidis could be an important step in supporting ongoing tobacco control efforts to reduce bidi smoking in India. Characterizing people who smoke bidis by sex, age, residence (urban/rural), education level, employment status, and wealth index is important to help further understand this population for developing public health approaches to address bidi smoking. In addition, understanding the knowledge about the dangers of smoking among people who smoke bidis could also be pivotal in developing targeted messages aimed at reducing the burden of chronic diseases caused by tobacco use, including smoking18.
Several studies have examined correlates of tobacco smoking (cigarettes, bidis, and combined) and smokeless tobacco use in India15,19-21. For example, Bhan et al.15 used nationally representative household data to examine trends in prevalence and volume of consumption of bidis and other tobacco products across socioeconomic status populations (SES). The study highlighted persistent SES patterning of tobacco use at household level and not at individual level, between 2000 and 2012. Mishri et al.19 used three nationally representative surveys to examine changing trends from 1998 to 2015 in any tobacco smoking, in bidi and cigarette smoking, and in smoking cessation among adults aged 15–69 years. Although they analyzed bidi smoking, the focus was on trends of overall smoking prevalence and number of smokers. Mini et al.20 examined the relationship between tobacco use and other factors such as demographic characteristics, wealth index, alcohol consumption, prevalence of NCDs and hospitalization due to NCDs (Non-Communicable Diseases). However, tobacco use is defined as ever smoking at least one cigarette/bidi at some point in one’s lifetime, with no specific analysis for bidi smoking.
Given the limited studies that have examined bidi smoking specifically and associated factors at a national level in India, this study aimed to fill this gap by examining the pattern of bidi smoking and its correlates among adults aged ≥15 years at a national level in India during 2009–2010 and 2016–2017. We used two waves of Global Adult Tobacco Survey (GATS) India, which provide data on those aged ≥15 years.
METHODS
Data
GATS India 2009–2010 and GATS India 2016–2017 are both nationally representative cross-sectional household surveys of adults aged ≥15 years with a total of 69296 respondents (overall response rate 91.8%) and 74037 respondents (overall response rate 92.9%), respectively. Both surveys were administered among non-institutionalized adults within 29 states and 2 union territories (Chandigarh and Puducherry). GATS is a global standard for systematically monitoring adult tobacco use and tracking key tobacco control indicators. It is a component of Global Tobacco Surveillance System (GTSS) and uses a standard core questionnaire, sample design, and data collection and management procedures that were reviewed and approved by international experts. Data are collected through face-to-face personal interview using electronic data collection procedures with the help of handheld devices. GATS data are weighted to produce nationally representative estimates and according to GATS Analysis package, the missing responses are excluded from the analysis22. The survey is designed to enhance the capacity of countries to design, implement and evaluate tobacco control interventions.
Measurement
We only considered adults who used specific tobacco products on a daily or less than daily basis and categorized as: 1) tobacco smokers, 2) manufactured cigarettes smokers, 3) bidi smokers, 4) smokeless tobacco users, and 5) non-bidi tobacco products users.
Knowledge of the dangers of smoking was defined by using four questions on the survey: three questions asked respondents whether they believed smoking tobacco causes lung cancer, heart attack, or stroke; and one question asked about their knowledge of the dangers of exposure to secondhand smoke. Following the method of Chiosi et al.23, we developed a knowledge scale by assigning one point for each correct (‘yes’) answer and summing the points, with total scores ranging from 0 (least knowledgeable) to 4 (most knowledgeable).
Demographic characteristics included sex (male, female), age group (15–24, 25–34, 35–44, 45–54, 55–64, ≥65 years), and residence (urban, rural). Education level was defined as no formal education, primary, secondary, and higher than secondary. Occupation was defined as government or non-government, daily wages/casual laborer or self-employed, retired or unemployed, homemaker, and student. For this analysis, the categories daily wages/casual laborer and self-employed were combined into one category for GATS India 2016–2017 to match the self-employed category in GATS India 2009–2010. The wealth index, a proxy of SES, defined as lowest, low, middle, high, and highest, is computed on the basis of household assets, such as electricity, flush toilet, fixed telephone, cell telephone, television, radio, refrigerator, car, moped/scooter/motorcycle, washing machine etc. Respondents were divided into wealth quintiles ranking from one (lowest) to five (highest)24.
Statistical analysis
Estimates and 95% confidence intervals were calculated for current bidi smoking among all respondents, by survey year, and demographic characteristics. In addition, for each survey year, relative changes were calculated between wave 1 and wave 2, both overall and by demographic characteristic; a z-test was used to assess p-values. Results were considered significant for p<0.05.
Multilevel logistic regression using pooled GATS India 2009–2010 and GATS India 2016–2017 data was applied to identify individual-level determinants of bidi smoking along with variation at neighborhood and state levels. The dependent variable was given a value of ‘1’ if a respondent was a current bidi smoker and ‘0’ if the respondent was a non-bidi smoker. Odds ratios (OR) and 95% confidence intervals of bidi smoking were computed for the following independent variables: age, sex, residence, education level, occupation, wealth index, state, use of non-bidi tobacco products, knowledge, and survey year. Although socioeconomic variables, such as wealth index, occupation, and education level, tend to be highly correlated variables, we found that by using the data from India, the correlations among these variables were not large enough to be of concern. Therefore, we included all three in the model. We kept the survey specific weights for the analysis, scaled based on Asparouhov’s25 method to reduce bias in variance estimation.
SAS (Ver. 9.4) was used for data processing and SAS-Callable SUDAAN (Ver. 11.0) was used to obtain weighted estimates of prevalence, relative change, and 95% confidence intervals. STATA (ver. 15) was used for multilevel analysis. GATS India data are weighted appropriately to ensure accurate representation of the national adult population for each wave of GATS. Because of the stratified nature of GATS India data, respondents are naturally nested into households, households into primary sampling units (PSUs), and PSUs into states. Thus, recognizing the hierarchically clustered nature of the survey data, we use multilevel logistic regression model to avoid possible underestimation of parameters from a single-level model26. As multilevel modeling explicitly models the clustered nature of data, it allows the investigation of variance within and across clusters. In addition, the multilevel model properly accounts for the correlation structure of the data that can occur in multistage survey sampling.
RESULTS
Patterns of bidi smoking
Table 1 shows the prevalence of current bidi smoking among adults during 2009–2010 and 2016–2017. Overall, bidi smoking prevalence significantly declined from 9.2% during 2009–2010 to 7.7% during 2016–2017 (p<0.05). This significant decline was observed across all demographic sub-groups, with the exception of those with primary and secondary education, and those with high or highest wealth index.
Table 1
Bidi smoking prevalence by sociodemographic characteristics and relative change across survey years, GATS India 2009–2010 and 2016–2017
| Bidi smoking prevalence 2009-2010 | Bidi smoking prevalence 2016-2017 | Relative changea | |||
|---|---|---|---|---|---|
| Sample | % (95% CI) | Sample | % (95% CI) | % | |
| Overall | 69296 | 9.2 (8.7–9.7) | 74037 | 7.7 (7.3–8.1) | -16.4* |
| Sex | |||||
| Male | 33767 | 16.0 (15.1–17.0) | 33772 | 13.9 (13.2–14.7) | -13.1* |
| Female | 35529 | 1.9 (1.6–2.3) | 40265 | 1.2 (1.0–1.3) | -38.6* |
| Residence | |||||
| Rural | 27471 | 5.5 (5.0–6.0) | 26488 | 4.7 (4.2–5.2) | -14.6* |
| Urban | 41825 | 10.7 (10.0–11.4) | 47549 | 9.3 (8.7–9.8) | -13.6* |
| Age (years) | |||||
| 15–24 | 13463 | 2.2 (1.8–2.7) | 13329 | 1.7 (1.3–2.0) | -25.7* |
| 25–44 | 35020 | 9.8 (9.1–10.6) | 35564 | 7.7 (7.1–8.3) | -21.9* |
| 45–64 | 16123 | 15.7 (14.6–16.8) | 19132 | 13.0 (12.2–13.8) | -17.1* |
| ≥65 | 4690 | 14.8 (13.2–16.5) | 6012 | 12.1 (10.9–13.4) | -18.2* |
| Education level | |||||
| No formal education | 18805 | 12.9 (12.0–13.8) | 18473 | 11.3 (10.5–12.1) | -12.3* |
| Primary | 16303 | 12.9 (11.9–14.0) | 16368 | 12.1 (11.2–13.1) | -6.0 |
| Secondary | 20185 | 5.7 (5.2–6.4) | 22440 | 5.8 (5.3–6.3) | 0.4 |
| Higher than secondary | 13863 | 2.5 (2.0–3.0) | 16697 | 1.9 (1.6–2.2) | -24.3* |
| Occupationb | |||||
| Government or non-government | 15928 | 12.9 (11.8–14.1) | 9614 | 6.5 (5.6–7.5) | -49.6* |
| Daily wages/casual laborer or self-employed | 19629 | 15.6 (14.5–16.8) | 27704 | 14.2 (13.4–15.1) | -9.1* |
| Retired or unemployed | 3932 | 13.7 (11.8–15.7) | 4722 | 11.2 (9.9–12.7) | -18.0* |
| Homemaker | 23858 | 2.6 (2.1–3.2) | 25833 | 1.5 (1.2–1.8) | -43.3* |
| Student | 5819 | 0.4 (0.2–0.8) | 6134 | 0.2 (0.1–0.4) | -53.2* |
| Wealth index (quintiles) | |||||
| Lowest | 13469 | 13.5 (12.5–14.6) | 15547 | 11.7 (10.8–12.6) | -13.7* |
| Low | 12209 | 10.8 (9.8–11.8) | 18685 | 9.3 (8.7–10.0) | -13.2* |
| Middle | 15945 | 8.7 (7.9–9.6) | 11278 | 6.9 (6.3–7.7) | -20.5* |
| High | 15967 | 5.7 (5.0–6.6) | 14814 | 4.9 (4.4–5.5) | -13.3 |
| Highest | 11706 | 2.4 (1.9–3.1) | 13713 | 2.4 (2.0–2.9) | 0.5 |
a The relative change (R) of the two estimates in the survey years 2009-2010 (r2009-2010) and 2016-2017 (r2016-2017) is calculated by R = [(r2009-2010)-(r2016-2017)]/(r2009-2010), as a percentage.
Bidi smoking prevalence varied by demographic characteristics in each survey wave. For 2009–2010, prevalence by sex was 16.0% for males and 1.9% for females, and by residence, 5.5% for urban and 10.7% for rural. For age groups, the prevalence ranged from 2.2% (15–24 years age group) to 15.7% (45–64 years age group); and by education levels, prevalence ranged from 2.5% (higher than secondary education) to 12.9% (no formal education and primary). Prevalence in occupation categories ranged from 0.4% (students) to 15.6% (daily wage/casual laborer or self-employed); and in wealth index, prevalence ranged from 2.4% (highest wealth index) to 13.5% (lowest wealth index).
During 2016–2017, bidi smoking prevalence by sex was 13.9% for males and 1.2% for females; and by residence, smoking prevalence was 4.7% for urban and 9.3% for rural. Among age groups, prevalence ranged from 1.7% (15–24 years age group) to 13.0% (45–64 years age group); and by education levels, prevalence ranged from 1.9% (higher than secondary education) to 12.1% (primary education). Prevalence in occupation categories ranged from 0.2% (students) to 14.2% (daily wage/casual laborer or self-employed); and in wealth index, prevalence ranged from 2.4% (highest wealth) to 11.7% (lowest wealth).
Table 2 shows that there were significant increases in reported knowledge among people who smoke bidis that smoking causes cancer (from 80.2% during 2009–2010 to 91.3% during 2016–2017), heart attack (from 54.6% during 2009–2010 to 72.7% during 2016–2017), stroke (from 42.7% during 2009–2010 to 61.4% during 2016–2017), and reporting the belief that secondhand smoke causes serious illness among non-smokers (from 77.8% during 2009–2010 to 90.0% during 2016–2017). There was a significant increase in the knowledge scale mean score (the belief that smoking causes stroke, heart attack, and lung cancer, and that breathing other people’s smoke causes serious illness among non-smokers), from 2.55 during 2009–2010 to 3.15 during 2016–2017.
Table 2
Knowledge and beliefs that tobacco smoking causes cancer, heart attack, and stroke among adults who smoke bidis, GATS India 2009–2010 and 2016–2017
| 2009–2010 | 2016–2017 | Relative changea | |
|---|---|---|---|
| % (95% CI) | % (95% CI) | ||
| Cancer | 80.2 (77.9–82.2) | 91.3 (90.1–92.4) | 13.9* |
| Heart attack | 54.6 (51.9–57.2) | 72.7 (70.7–74.7) | 33.3* |
| Stroke | 42.7 (39.9–45.6) | 61.4 (59.1–63.7) | 43.8* |
| Belief that secondhand smoke causes serious illness among nonsmokers | 77.8 (75.6–79.9) | 90.0 (88.7–91.2) | 15.7* |
| Knowledge scaleb mean score (95% CI) | 2.55 (2.47–2.63) | 3.15 (3.10–3.21) | 23.8* |
a The relative change (R) of the two estimates in the survey years 2009-2010 (r20092010) and 2016-2017 (r2016-2017) is calculated by R=[(r2009-2010)-(r2016-2017)]/(r2009-2010), as a percentage.
b Knowledge scale – developed from questions about belief that smoking tobacco causes lung cancer, heart attack or stroke, and knowledge of the dangers of exposure to secondhand smoke. Scale is addition of all the ‘Yes’ responses to each question, with one point assigned for each correct answer and total scores ranging from 0 (least knowledgeable) to 4 (most knowledgeable).
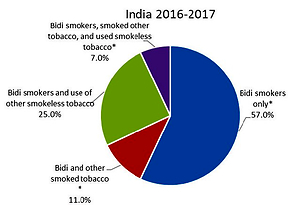
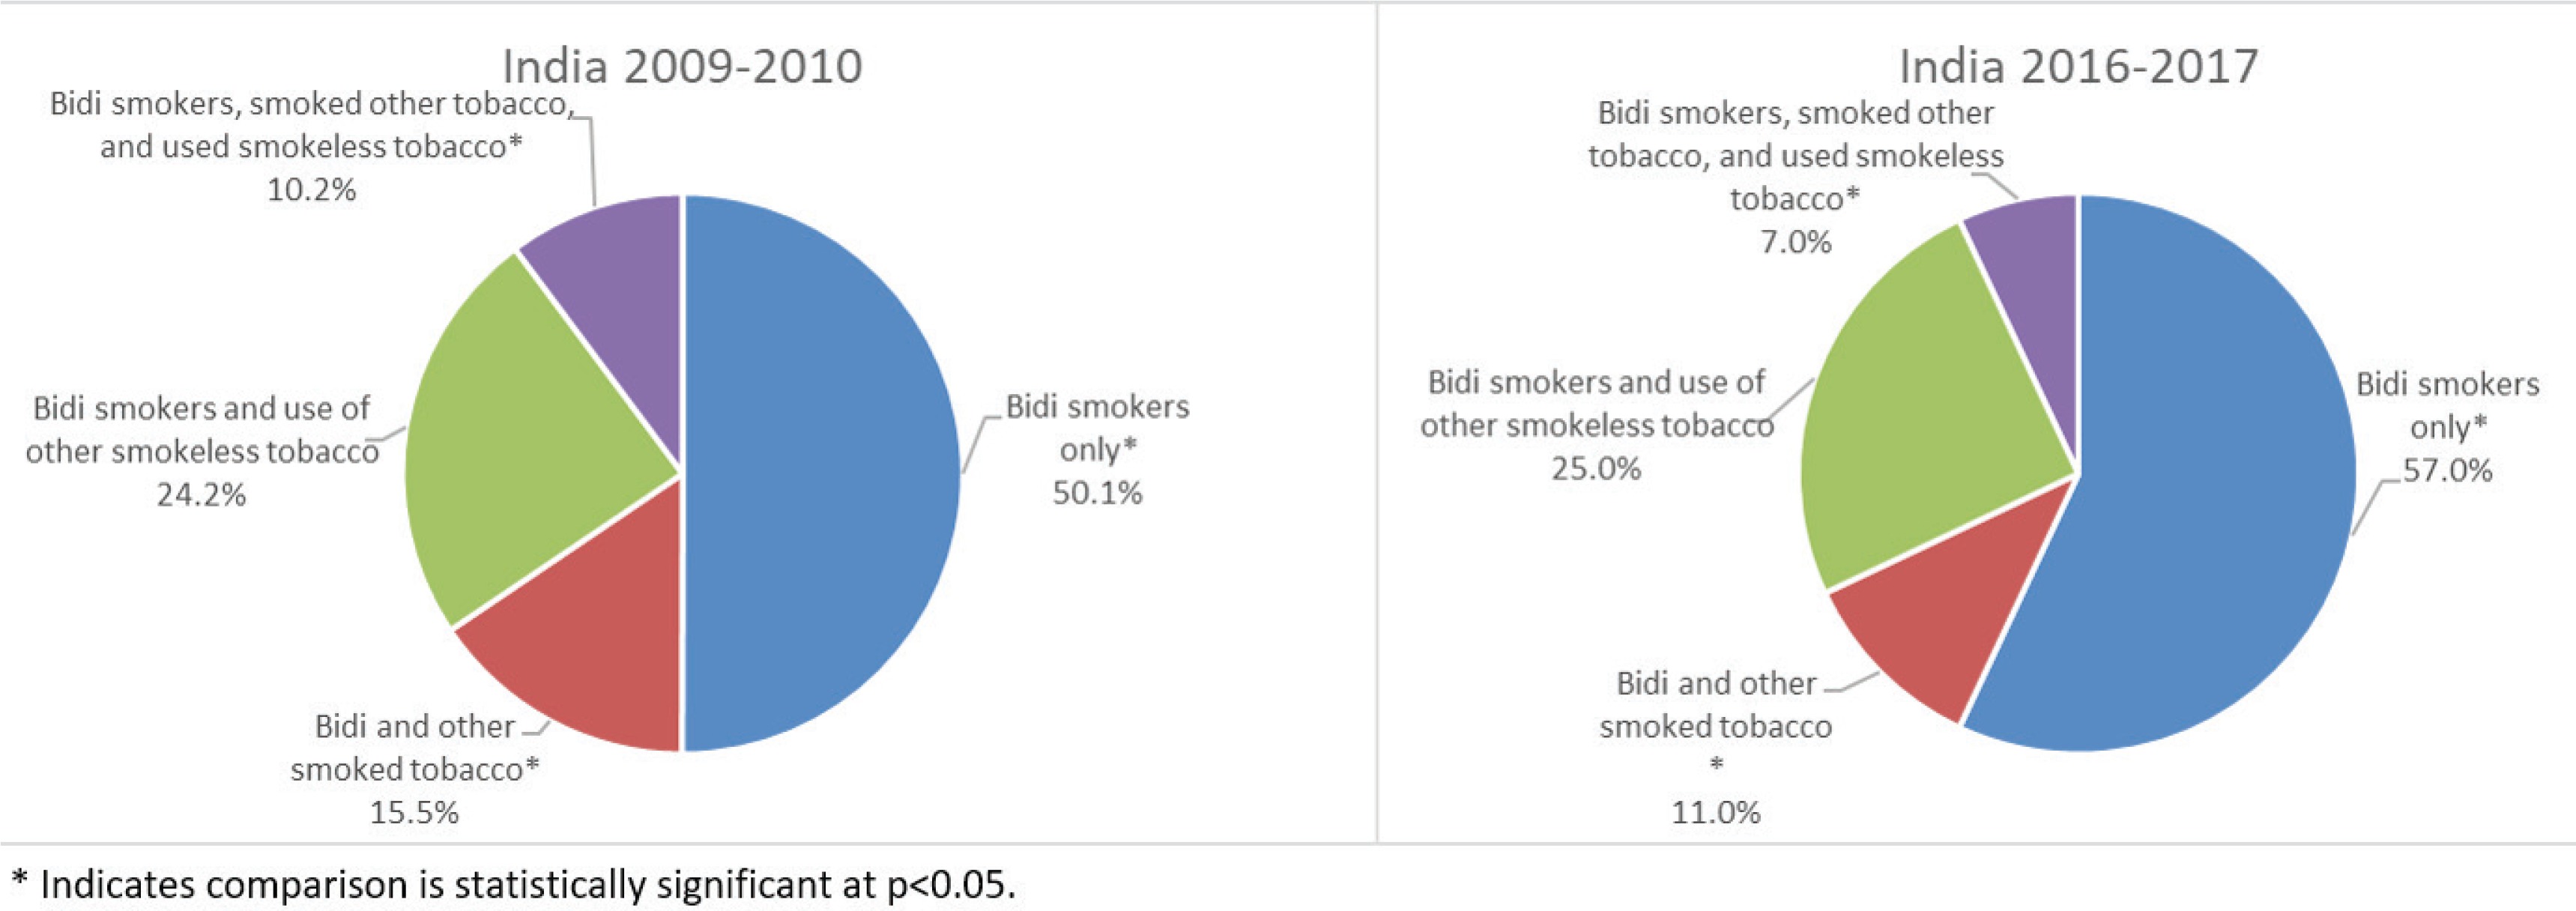
Figure 1 shows the use of other tobacco products among adults who smoked bidis. The proportion of adults who smoked bidis-only significantly increased from 50.1% during 2009–2010 to 57.0% during 2016–2017. The proportion of adults who smoked bidis and other smoked tobacco products significantly declined from 15.5% during 2009–2010 to 11.0% during 2016–2017. The proportion of adults who smoked bidis and used both other smoked tobacco and smokeless tobacco also significantly declined from 10.2% to 7.0%. The proportion of adults who smoked bidis and used smokeless tobacco remained about the same.
Factors associated with bidi smoking
Table 3 shows the results of the multilevel logistic regression models for bidi smoking and its correlates by using pooled GATS India 2009–2010 and GATS India 2016–2017 data. All variables in the pooled model were significantly associated with bidi smoking.
Table 3
Bidi smoking and related risk factors among adults aged 15 years or older by using multilevel logistic regression analysis, pooled GATS India 2009–2010 and 2016–2017a,b
| Characteristics | OR | 95% CI |
|---|---|---|
| Sex | ||
| Male | 17.1* | (11.3–25.9) |
| Female | Ref. | − |
| Residence | ||
| Rural | 1.5* | (1.3–1.8) |
| Urban | Ref. | − |
| Age (years) | ||
| 15–24 | Ref. | − |
| 25–44 | 3.0* | (2.3–4.0) |
| 45–64 | 5.5* | (3.8–8.0) |
| ≥65 | 4.5* | (3.1–6.5) |
| Education level | ||
| No formal education | 6.0* | (4.9–7.3) |
| Primary | 4.3* | (3.6–5.0) |
| Secondary | 2.4* | (2.1–2.7) |
| Higher than secondary | Ref. | − |
| Occupation | ||
| Government or non-government | 3.3* | (1.9–5.5) |
| Daily wages/casual laborer or selfemployed | 3.5* | (2.1–5.9) |
| Retired or unemployed | 3.1* | (2.0–4.8) |
| Homemaker | 2.7* | (1.7–4.3) |
| Student | Ref. | − |
| Wealth index (quintiles) | ||
| Lowest | 2.5* | (2.1–3.2) |
| Low | 2.3* | (1.9–2.9) |
| Middle | 2.0* | (1.7–2.5) |
| High | 1.8* | (1.6–2.1) |
| Highest | Ref. | − |
| Tobacco users, non-bidi only | ||
| Yes | 1.6* | (1.2–2.1) |
| No | Ref. | − |
| Survey year | ||
| 2009–2010 | Ref. | − |
| 2016–2017 | 0.8* | (0.7–1.0) |
| Knowledge scale | ||
| Knowd | 0.9* | (0.9–0.9) |
| Variance within clusters | VPCc | |
| Primary sampling unit | 2.2* (1.7–2.7) | 15.9% |
| State | 2.2 (1.8–2.6) | 31.8% |
a Included three hierarchical levels: individual level, primary sampling unit (psu) level, and state level.
b All estimates are weighted, scaled on the basis of Asparouhov's method to reduce bias in variance estimates.
Males (adjusted odds ratio, AOR:=17.1; 95% CI: 11.3–25.9) had higher odds for current bidi smoking than females. The AOR was significantly higher among rural residents compared with urban residents, and those aged 25–44, 45–64, and ≥65 years had higher odds relative to the youngest age group (15–24 years). By education level, adults with no formal education, primary, and secondary education, had greater odds of bidi smoking relative to higher than secondary education level. Among wealth index categories, lowest, low, middle, and high wealth index categories had higher odds of bidi smoking relative to the highest wealth index. Users of non-bidi tobacco products had higher odds of bidi smoking relative to those who did not. The second survey cycle and a higher mean knowledge about dangers of smoking were both significantly associated with lower odds of bidi smoking.
DISCUSSION
Bidi smoking prevalence in India declined from 9.2% during 2009–2010 to 7.7% during 2016–2017, representing a significant relative decline of 16.0%, or 1.5 million fewer adults who smoke bidis; this decrease was noted despite the increase in the population of India1. Our findings show that bidi smoking was associated with being male, rural residence, no formal education, age group 45–64 years, being daily wages/casual laborers or self-employed, having the lowest wealth index, and use of non-bidi tobacco.
The findings are consistent with other studies that have shown high smoking prevalence among males and older adults in India19,27-29. In particular, Mishra et al.19, in their study of trends in bidi and cigarette smoking in India from 1998 to 2015, found smoking rates were high among males and a substantial increase in the number of male smokers aged 15–69 years. Similar to our findings, Mishra et al.19 also found that bidi smoking rates were lower among the young age group (15–24 years) and higher among those aged 25–44 and 45–64 years. These findings suggest that efforts to prevent and reduce smoking in India could focus strategies on males and older bidi smokers, while at the same time developing strategies that target smoking in general among the younger population. For example, prevention messages targeting adults aged ≥25 years could focus on the dangers of bidi smoking, whereas messages targeting younger adults (aged ≤24 years) could focus on the dangers of smoking in general.
Our analysis also shows an association between bidi smoking and education level, occupation, and wealth index. Adjusted odds of bidi smoking were higher among those with lower education level, daily wages/casual laborers or self-employed, retired or unemployed, and those with the lowest wealth index. This may reflect an association between the lower socioeconomic status population and bidi smoking. These study findings are consistent with other studies that have shown that bidi smoking in India is higher among the low SES population15,29,30. For example, Agrawal et al.31 found that despite an overall decline in bidi smoking in India from 2000 to 2012, bidi smoking continued to be associated with low SES. Given these findings, it may be important for tobacco control in India to focus on preventing and reducing bidi smoking through adoption of strategies that target low SES populations.
Furthermore, our findings show that a higher level of knowledge about smoking-related health consequences was associated with lower odds of bidi smoking. Thus, increasing knowledge about the health risks of smoking may help to prevent and reduce bidi smoking in India. In this regard, addressing knowledge about the dangers of smoking could be important in preventing and reducing bidi smoking in India32,33.
Finally, we observed that about half of the adults who smoked bidis also used other tobacco products. The results reflect the presence of a myriad of tobacco products in India and a challenge for tobacco control and prevention efforts1. In addressing this challenge, one important strategy could be to implement tobacco tax increases in line with WHO recommendations as part of a comprehensive tobacco control and prevention strategy uniformly targeting all tobacco products34. For example, the Indian government’s introduction of a new Goods and Services Tax (GST) structure to tax cigarettes, smokeless tobacco and bidis at the highest rate of 28% may present a step towards a comprehensive tobacco control effort by phasing out fiscal benefits and exemptions given to the bidi industry16. Previously, the GST regime gave a tax exemption to bidi manufacturers with less than 2 million INR turnover annually16.
Overall, the continued smoking of bidi, particularly among the low SES population may need concerted efforts to address the availability and affordability of bidi products in India. For example, cigarette taxes in India are levied on the basis of cigarette length and ranged from 168 to 543 INR per 1000 sticks for non-filtered cigarettes and 819 to 2163 INR for filtered cigarettes during the financial year 2007–200812. However, the tax on 1000 sticks of handmade bidis was 14 INR and machine-made bidis were taxed at 26 INR per 1000 sticks12. Despite the 2017 Union Budget increasing tobacco tax, it was argued that the tax increase did not go far enough, particularly on the bidi prices, to make a significant impact in decreasing bidi smoking in India35. As recommended by the Public Health Foundation of India16, increasing taxes on bidis by levying a ‘cess’ (a form of tax on tax, levied by a government to raise funds for a particular purpose) over and above 28% (as for cigarettes), could help prevent any potential product switching and encourage cessation, particularly among the low SES population.
Limitations
This study is subject to at least two limitations. First, the data were self-reported without bioassay validation and thus subject to potential misreporting from inaccurate recall or a desire to give socially acceptable answers. In addition, GATS use a standard protocol implemented in various other countries22. However, in general, self-reported data on conventional tobacco usage are considered to be sufficiently accurate in monitoring the general pattern of tobacco usage among populations36,37. Secondly, we used the wealth index as a proxy for socioeconomic status, which may not be accurate. However, wealth index is a well-accepted proxy measure of SES in household surveys38,39.
CONCLUSIONS
Although India witnessed a significant decline in bidi smoking prevalence during the last decade, there are 71.8 million adults who currently smoke bidis. Importantly, most adults who smoke bidis in India are mainly in the low SES population, and this could be compounded by many factors, including a knowledge gap about the health consequences of smoking and the relative low price of bidis compared to cigarettes40. Targeted health education and awareness interventions that reach the lower SES populations across India could be important strategies to address bidi smoking in the country. In addition, increasing the price of bidis may also help to encourage cessation among adults who smoke tobacco and prevent initiation among the youth41. Finally, intervention strategies to reduce and prevent bidi smoking in India are important at both national and state levels, particularly for states with higher prevalence of use. Understanding the characteristics of adults who smoke bidis and their knowledge of the dangers of smoking could help interventions that can facilitate lifestyle change through a combination of efforts to enhance awareness, change behavior, and create environments that support good health practices18.